Machine Learning Pipeline on AWS
Machine Learning Pipeline on AWS
Course Objectives
- Select and justify the appropriate ML approach to a problem
- Build ,train ,evaluate and deploy and fine-tune and ML model
- Apply the steps of the Ml pipeline to solve the problem
- Describe Best practices for training and deploying ML models pipeline in AWS
- Identify the steps to apply the ML to business problems
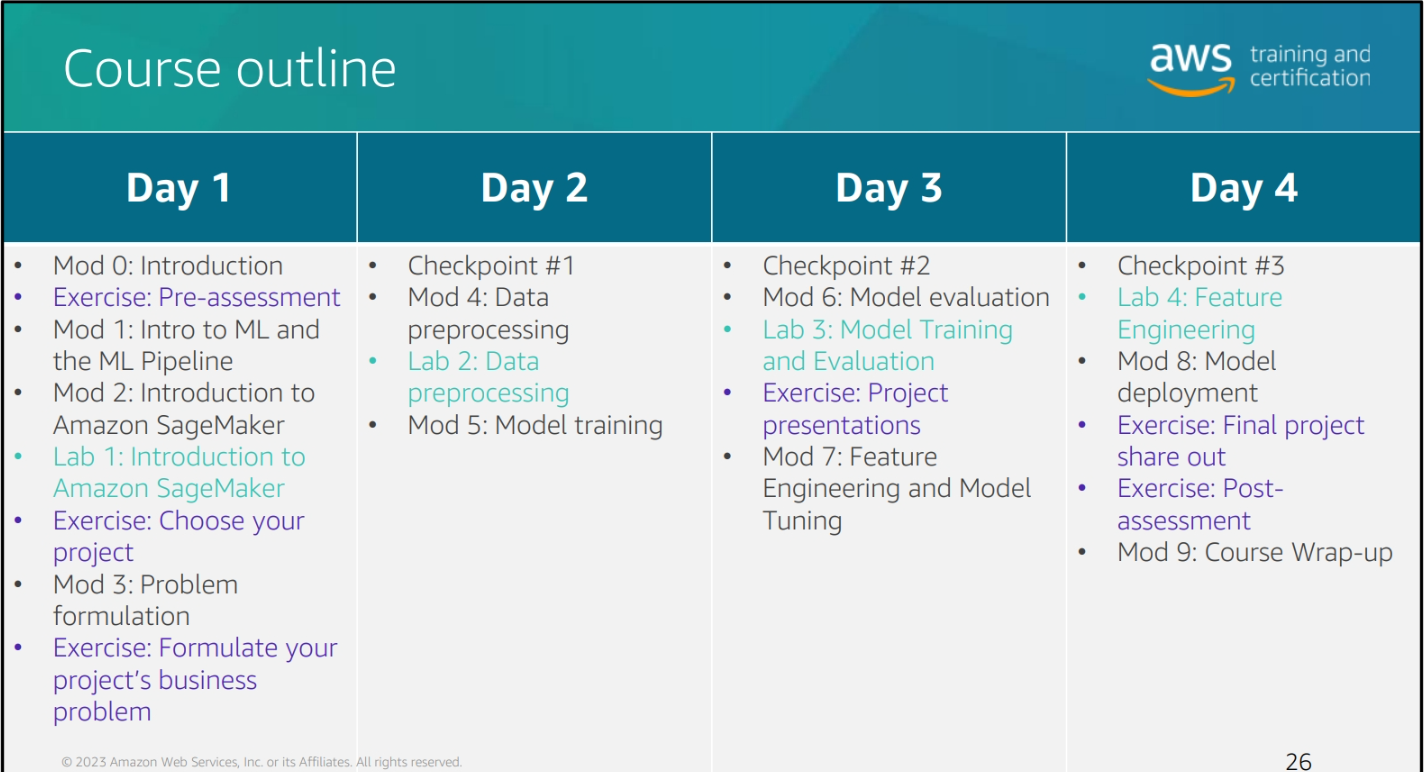
Course Outline
Module 1: Introduction to Machine Learning and Ml Pipeline
Data + Algorithm + Time = Model
Inferencing: Ask a question to the model
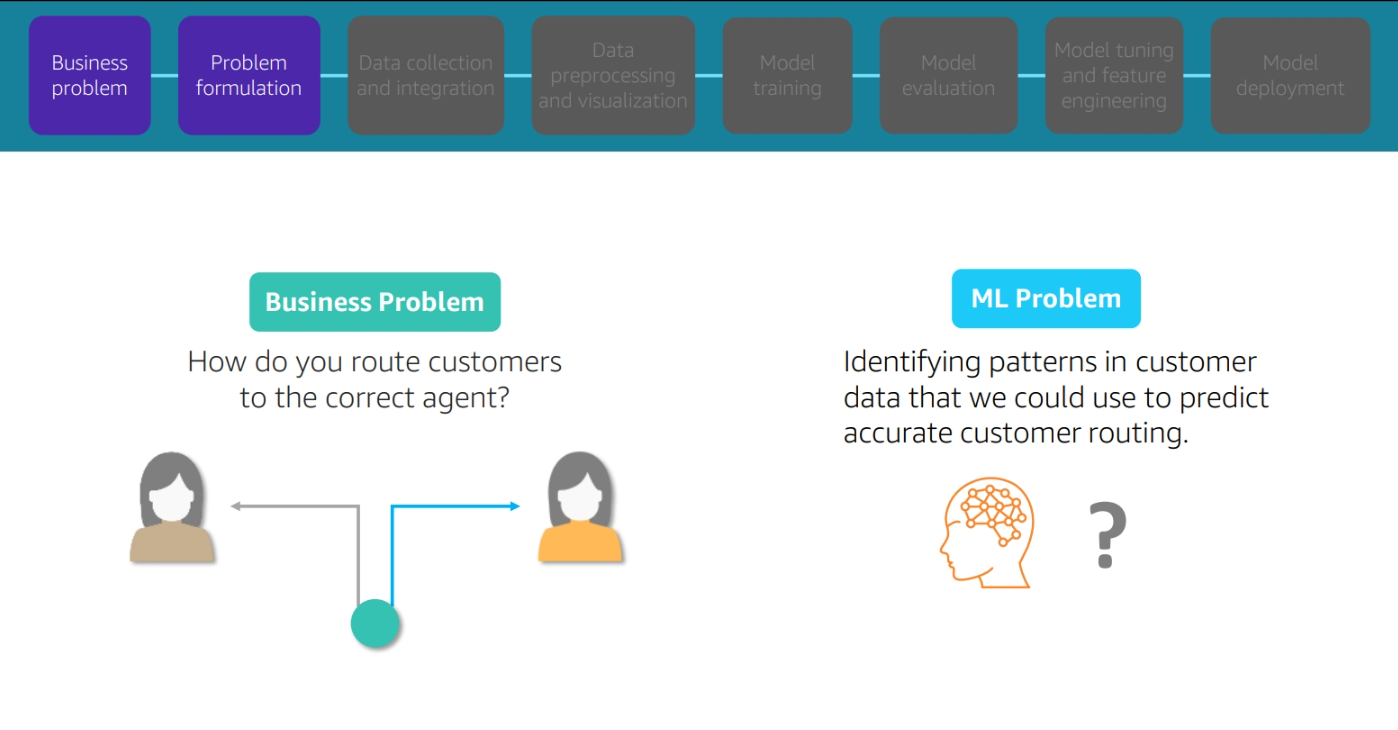
Business Need
Your site needs to be able to predict the likelihood of a customer purchasing a product based on their browsing history.
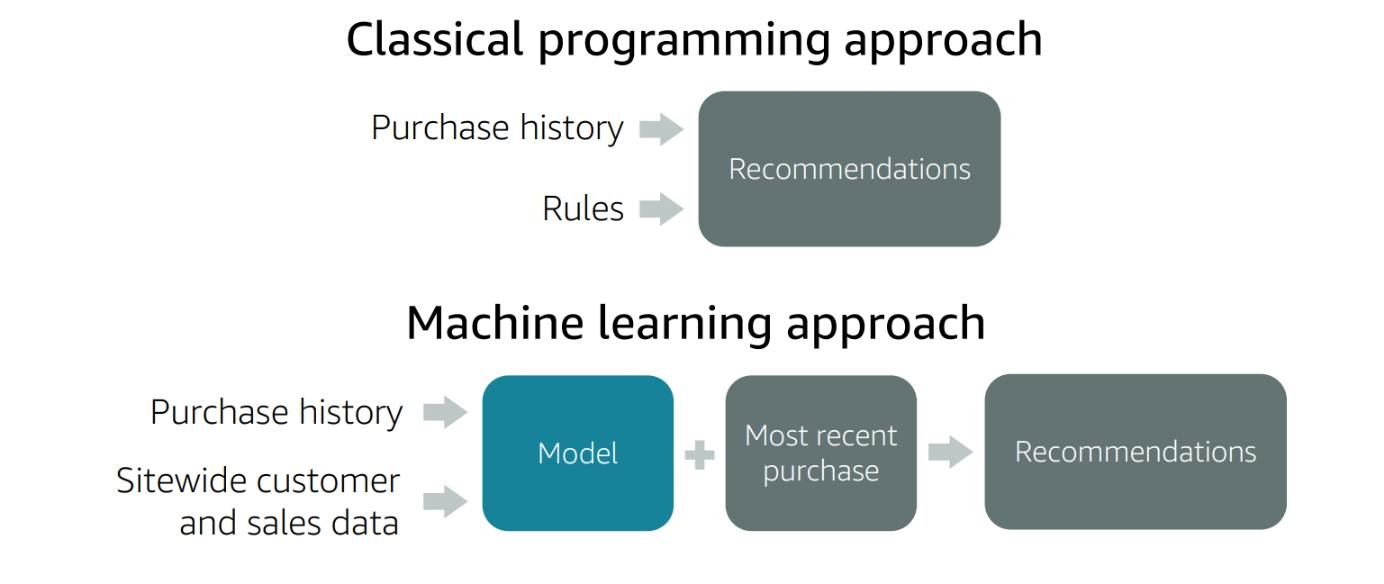
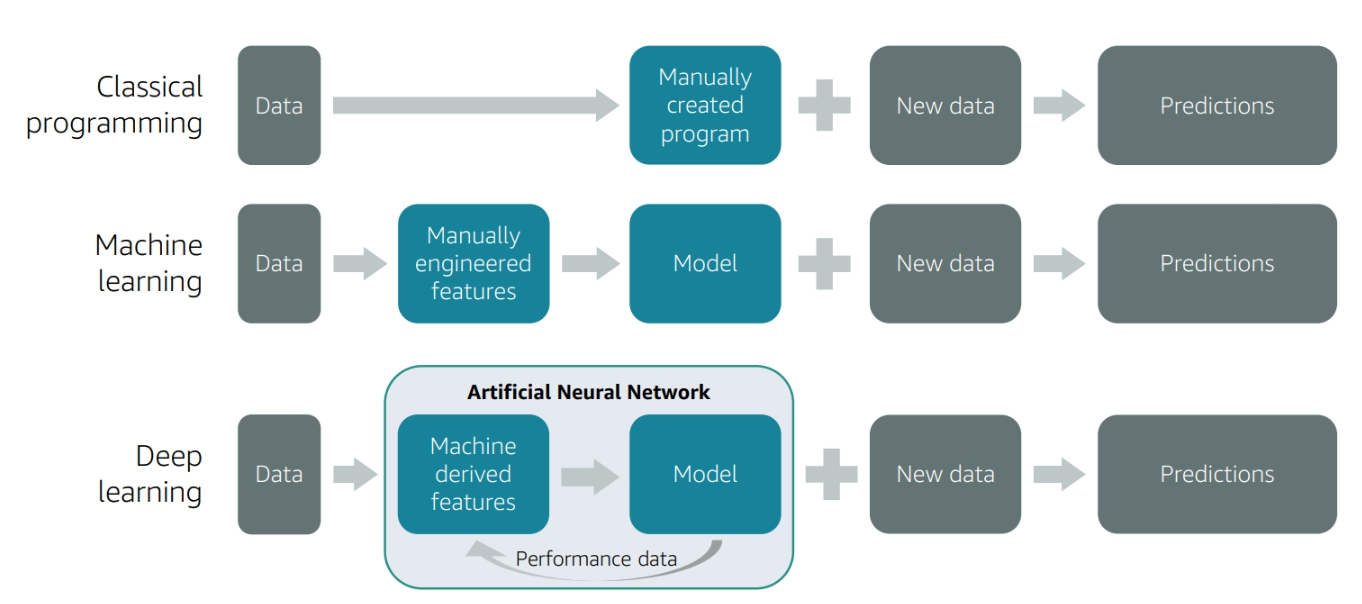
Classical programming vs Machine Learning
-
Classical programming:
- Input + Rules = Output
- Rules are defined by the programmer
- Rules are fixed
-
Machine Learning:
- Input + Output = Rules
- Rules are learned from the data
- Rules are flexible
Feature and Weight
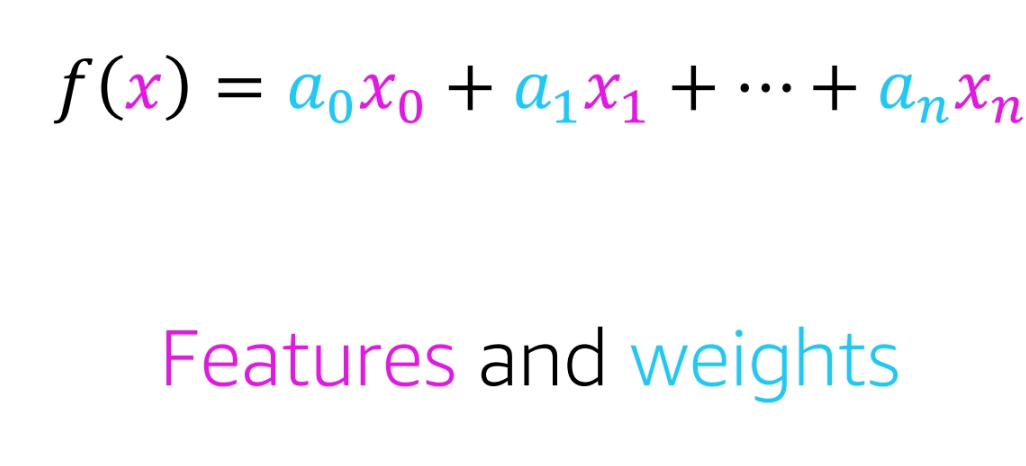
- Feature: A characteristic of the data
- Weight: A measure of the importance of a feature
Supervised Learning vs Unsupervised Learning vs Reinforcement Learning
- Supervised Learning:
- Input + Output = Model
- The model is trained on labeled data
- The model is used to make predictions on new data
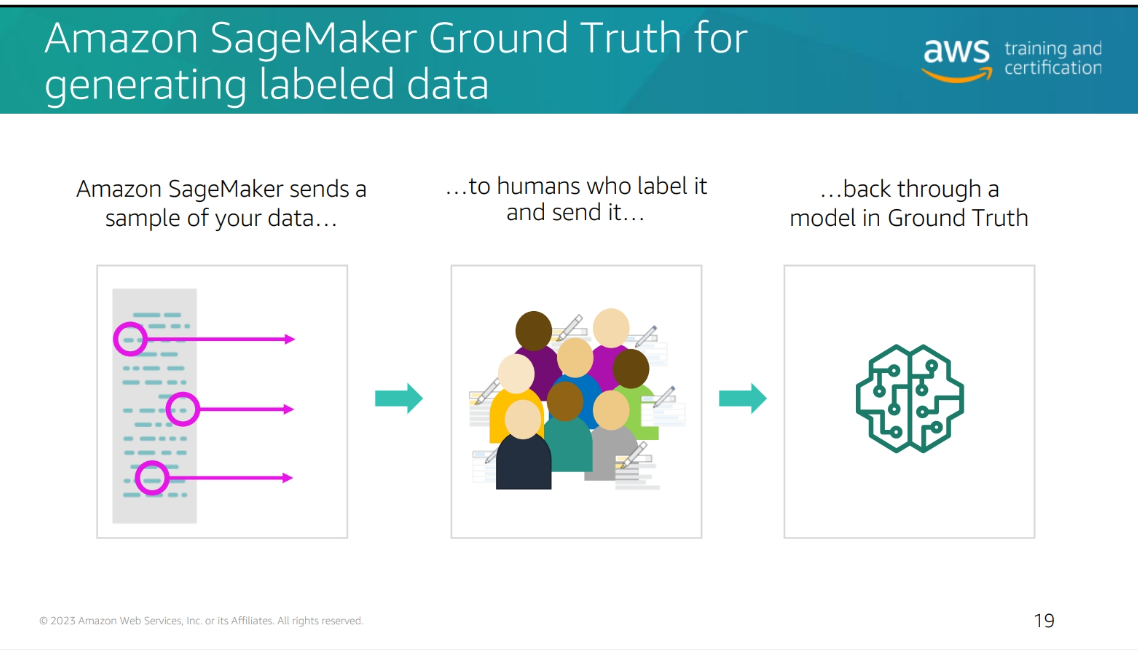
Amazon SageMaker labeling jobs
Amazon SageMaker offer labeling jobs to help you label your data. You can use the labeling jobs to create labels for your data. You can use the labels to train your machine learning models. You can use the labels to evaluate your machine learning models. You can use the labels to make predictions with.
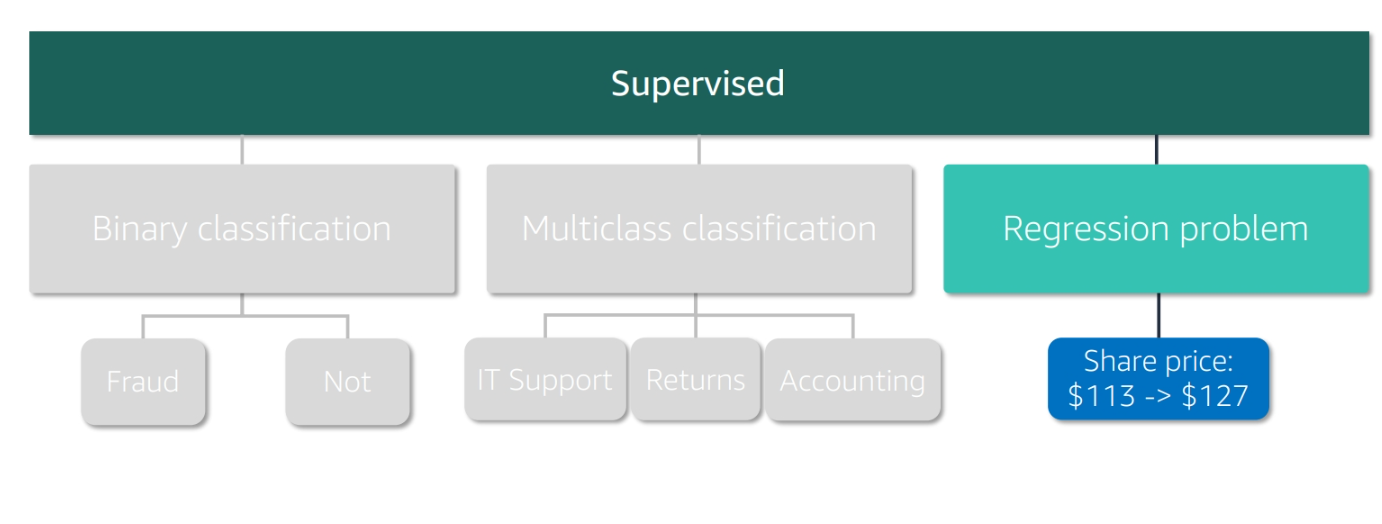
Types of Supervised Learning
- Binary Classification: Predicting one of two classes
- For example, predicting whether an email is spam or not spam
- Multiclass Classification: Predicting one of many classes
- For example, predicting the genre of a movie
- Regression: Predicting a continuous value
- For example, predicting the price of a house
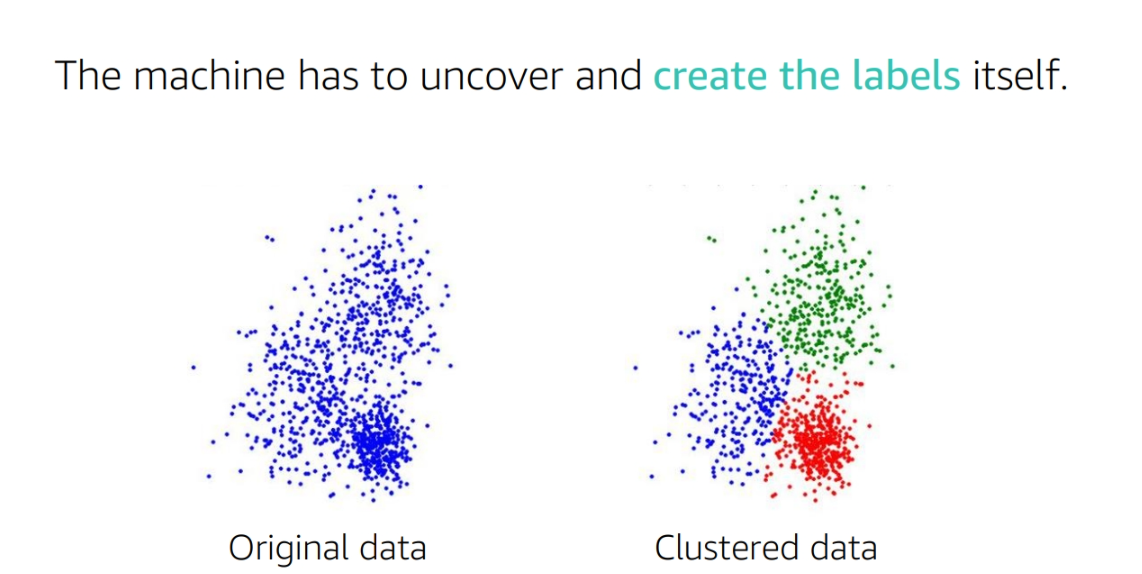
UnSupervised
- Unsupervised Learning:
- Input = Model
- The model is trained on unlabeled data
- The model is used to find patterns in the data
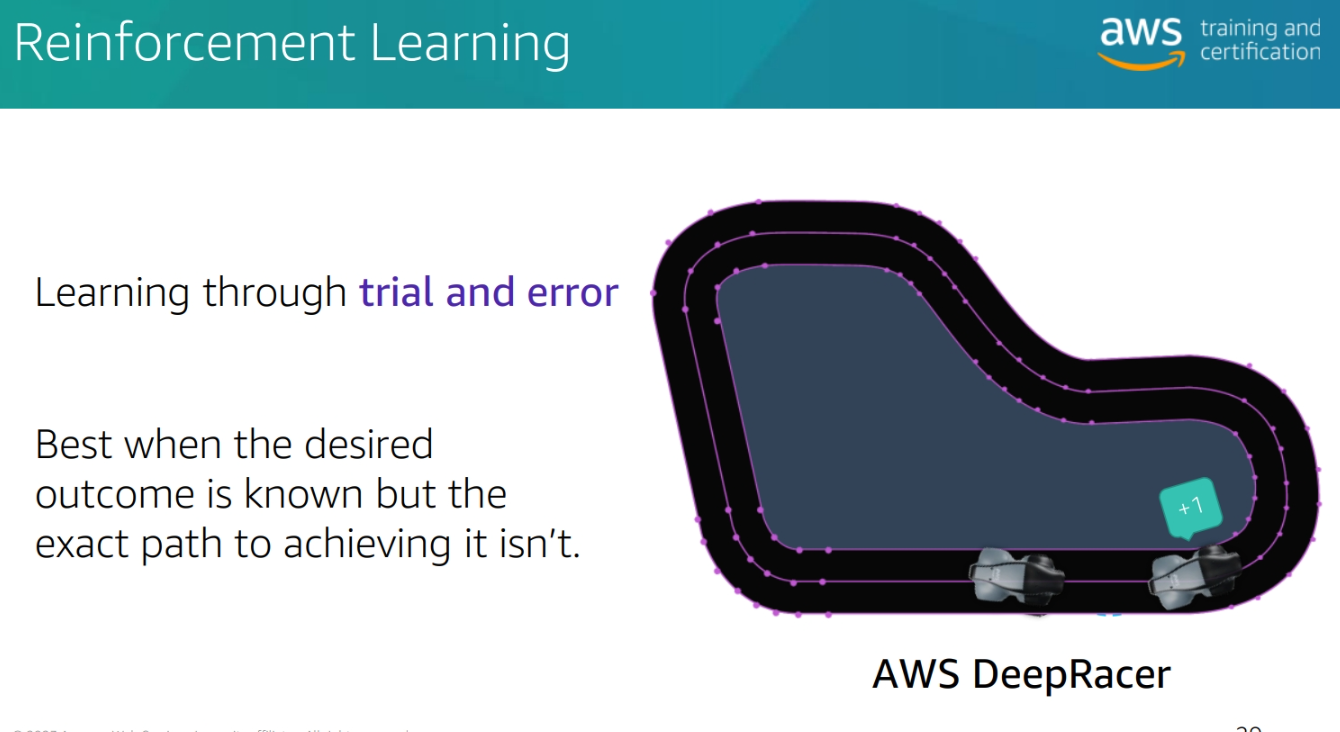
Reinforcement Learning
- Reinforcement Learning:
- Input + Output = Model
- The model is trained on feedback from the environment
- The model is used to make decisions in the environment
Deep Learning
- Deep Learning:
-
A type of machine learning
-
Uses neural networks
-
Can learn from unstructured data
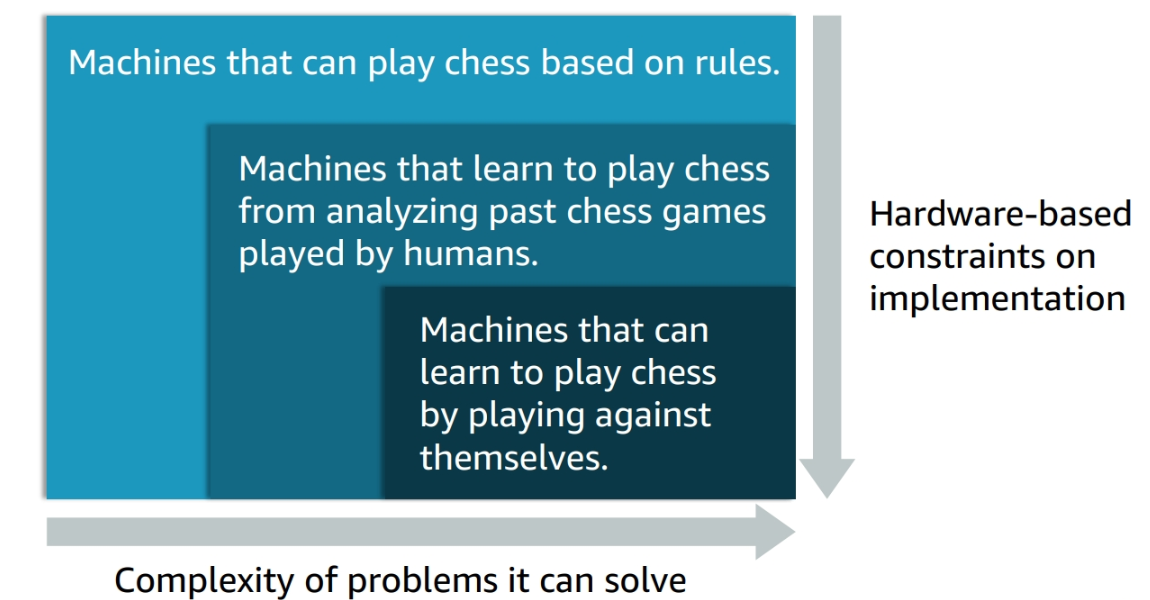
The figure demonstate going from AI to ML to Deep Learning
-
Deep Learning recap
- Deep learning models
- Learn using Artificial Neural Networks (ANN)
- Can be trained on raw features
- Include:
- A subset of ML methods
- Neurons arranged for computational efficiency
- Training networks with hundreds of layers that learn and improve the features
Machine Learning use cases
- Recommendation Systems: Predicting what a user will like
- Fraud Detection: Predicting whether a transaction is fraudulent
- Voice Recognition: Predicting what a user is saying.
- Image Recognition: Predicting what is in an image
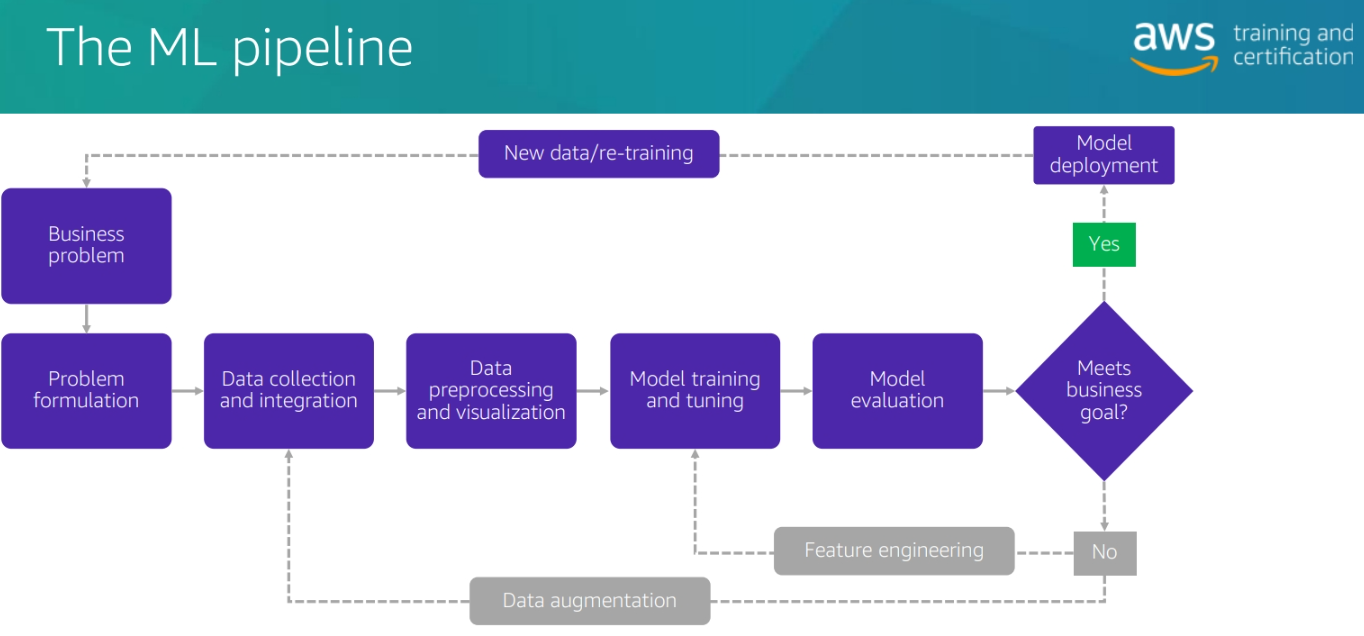
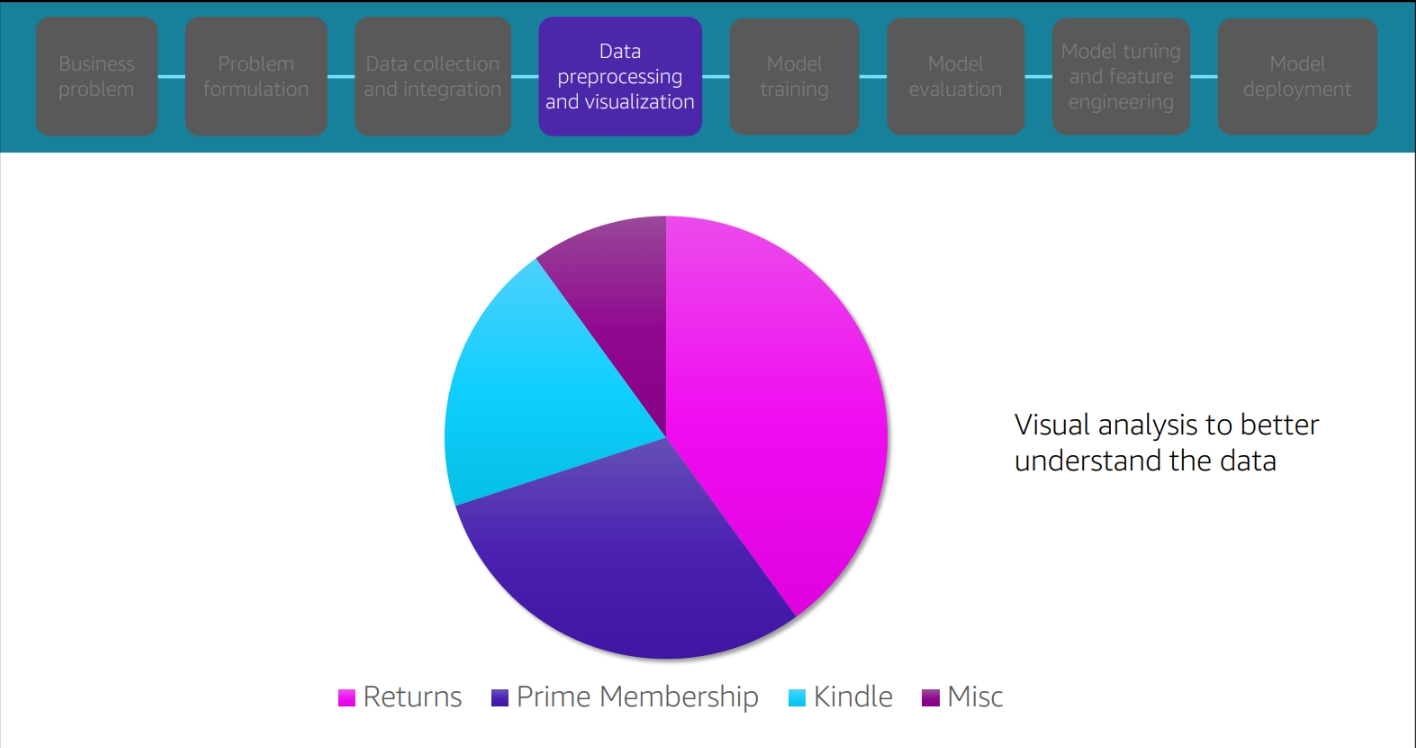
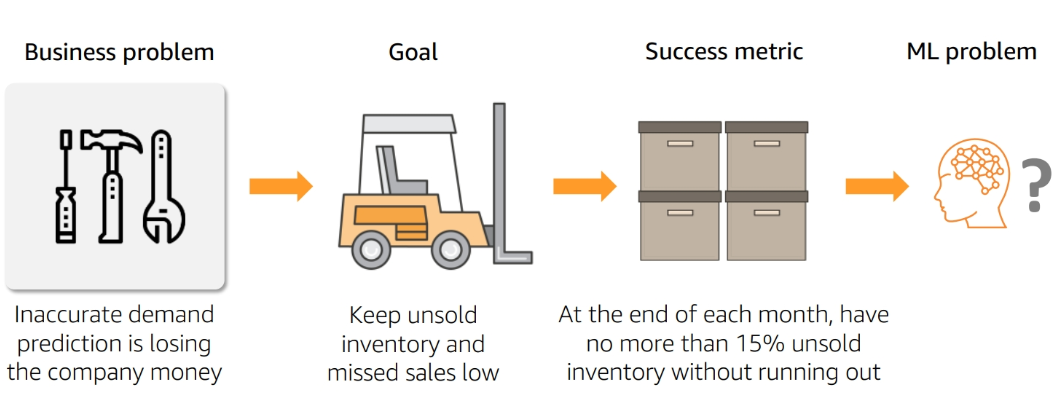
The Pipeline of ML Problem for buy kindle
Bussines problem and Problem Formulation
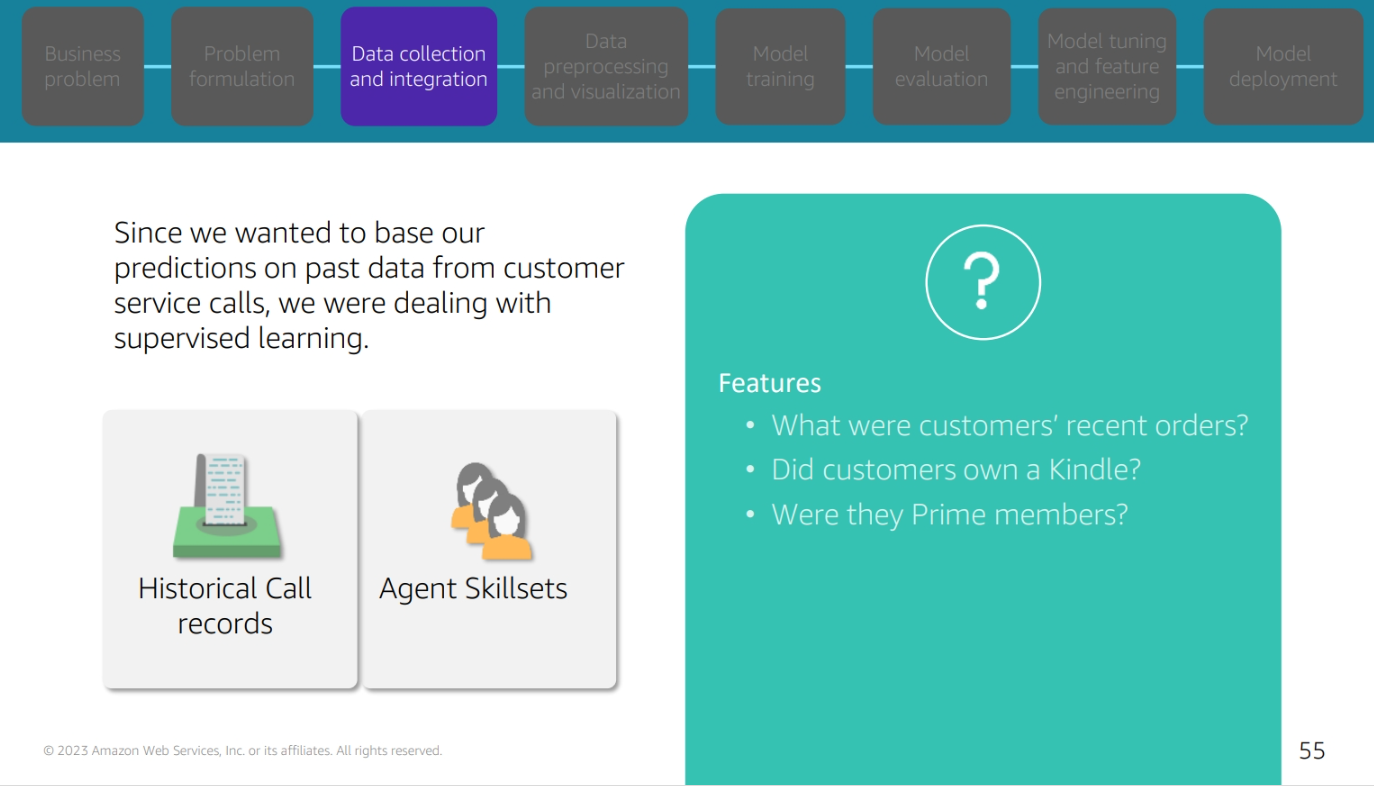
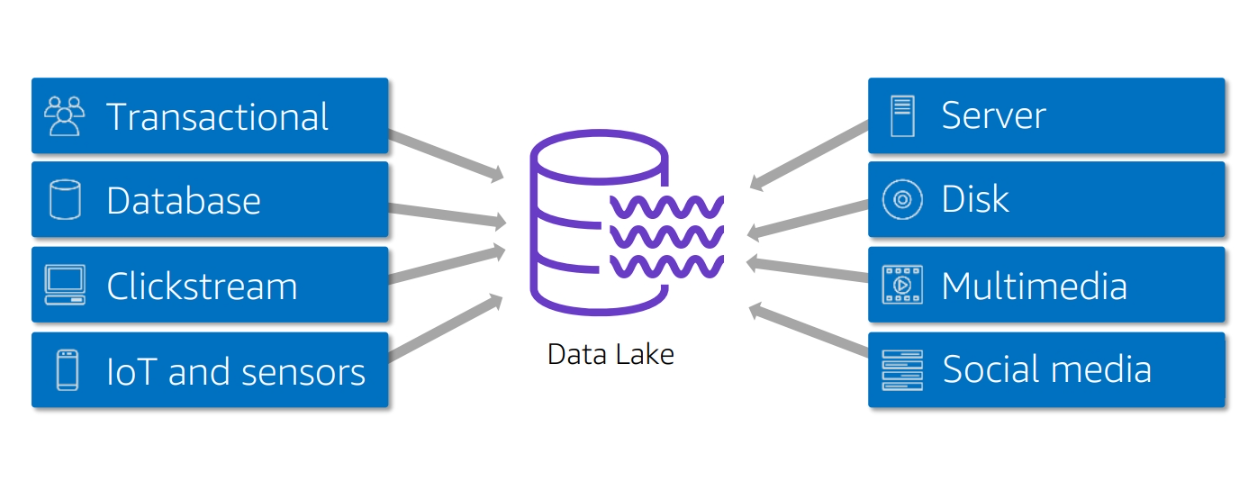
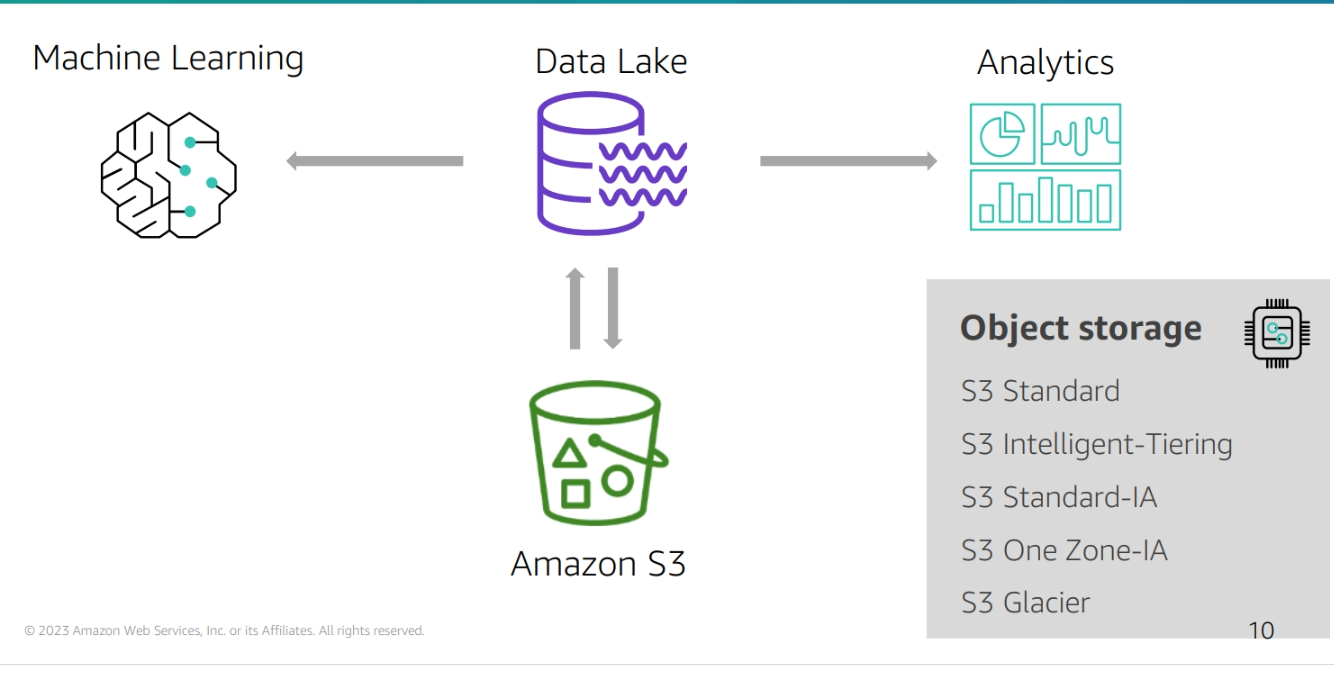
Data collection and integration
Data preprocessing and visulization
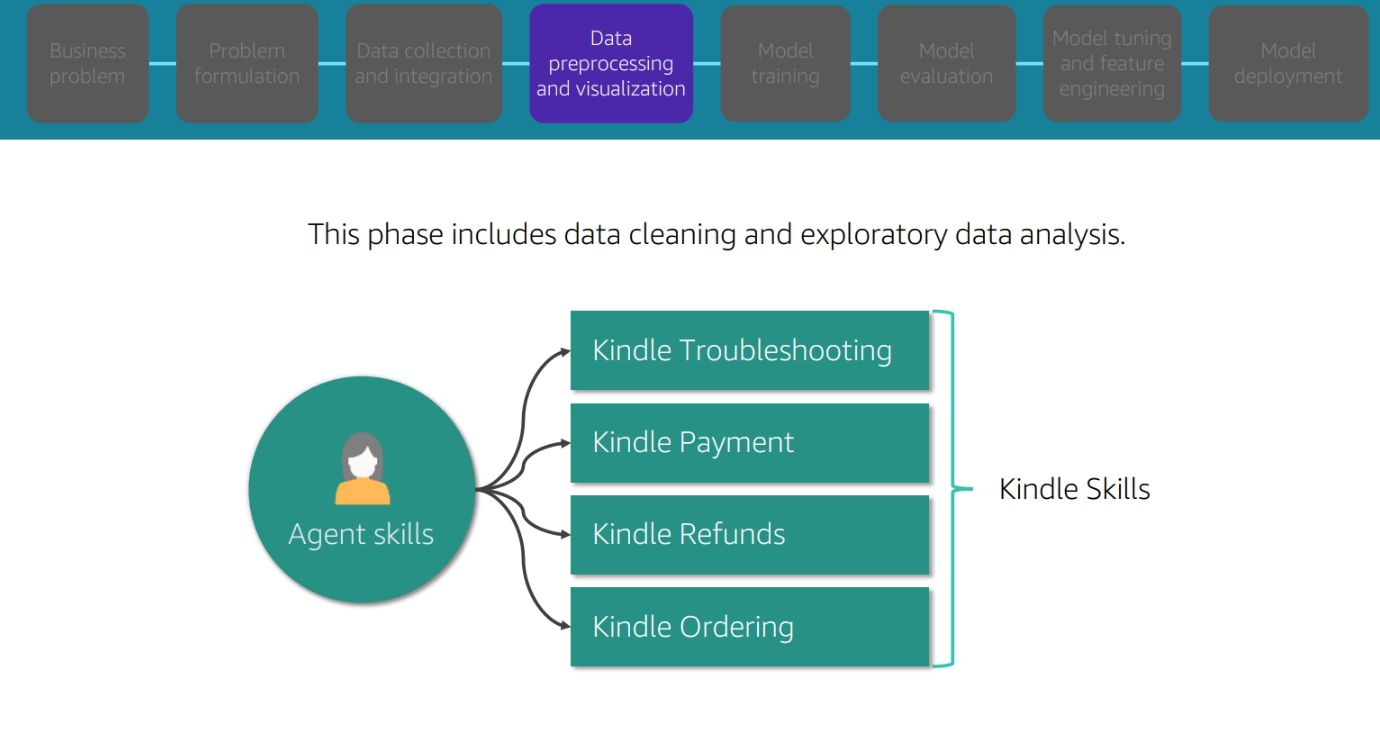
Data prepprocessing and visualization
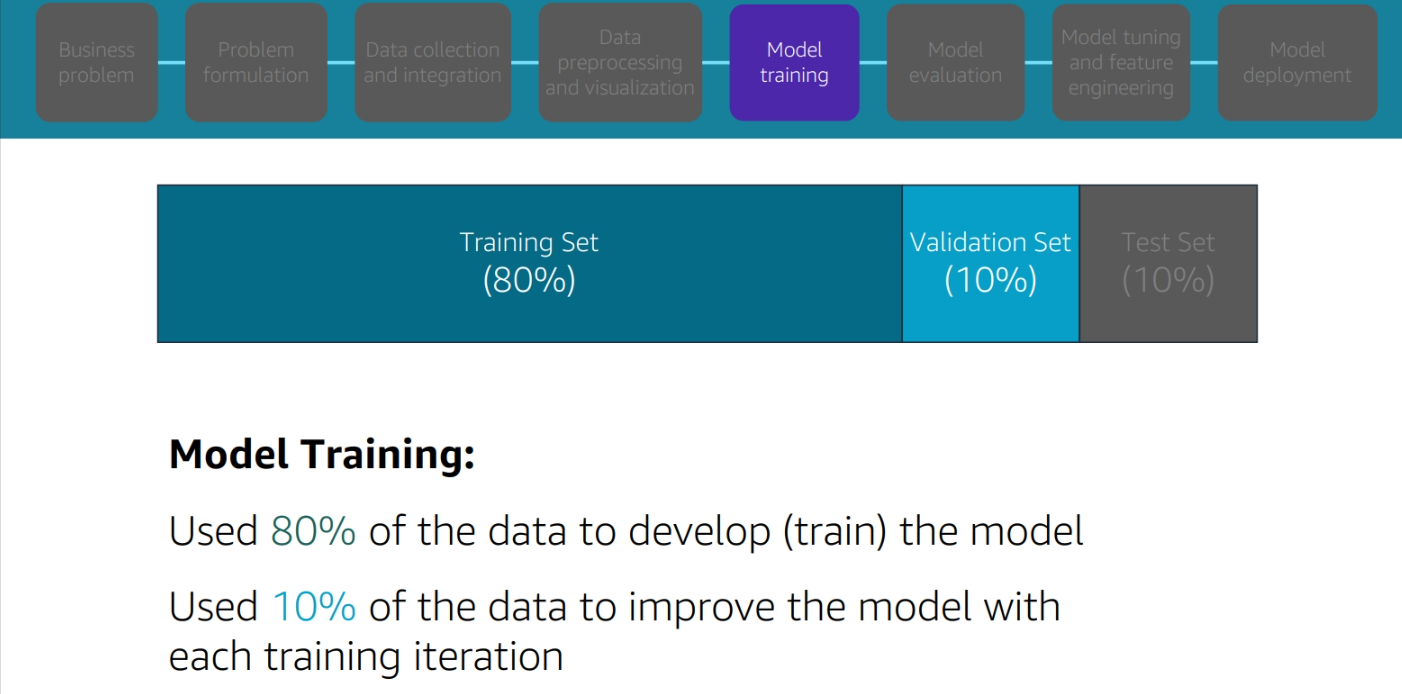
Model Training
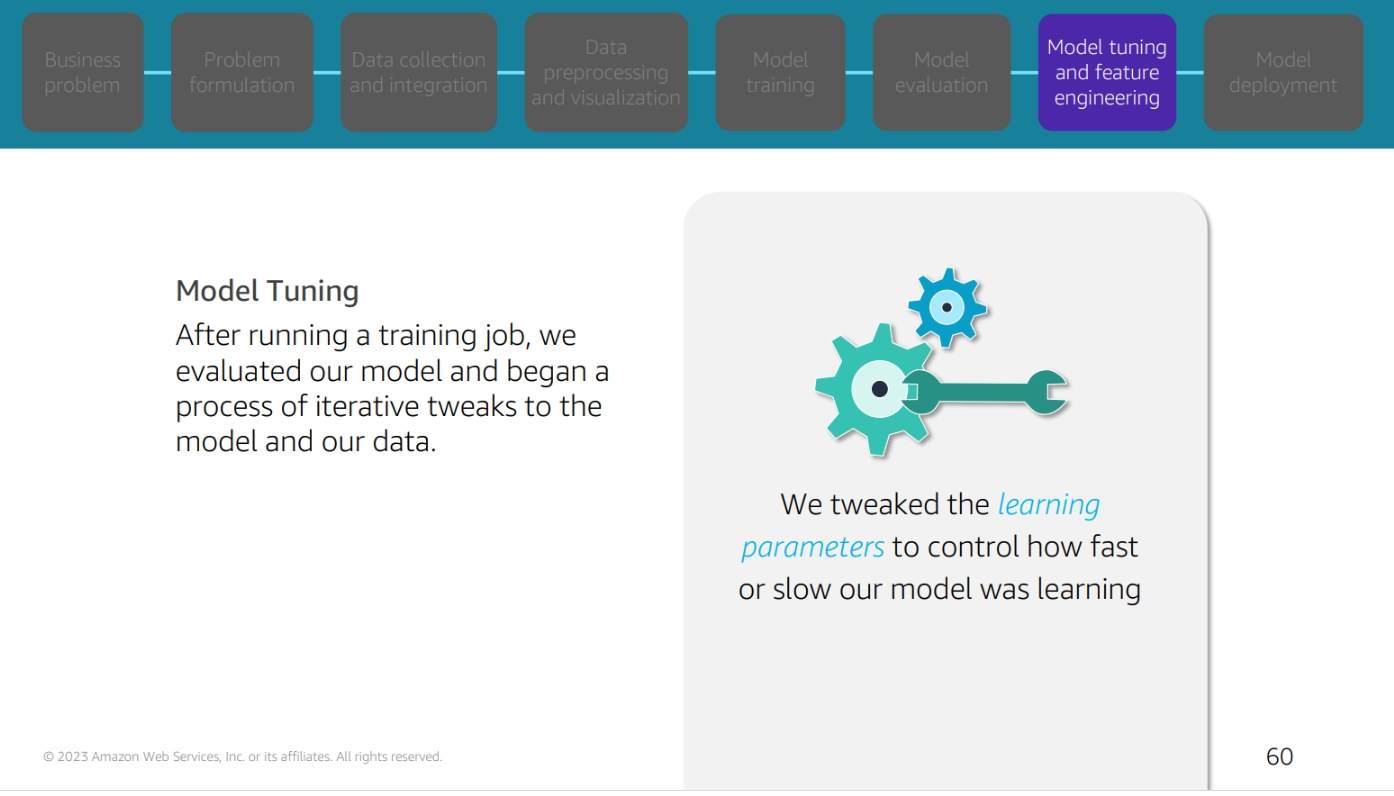
Model tuning and feature enginnering
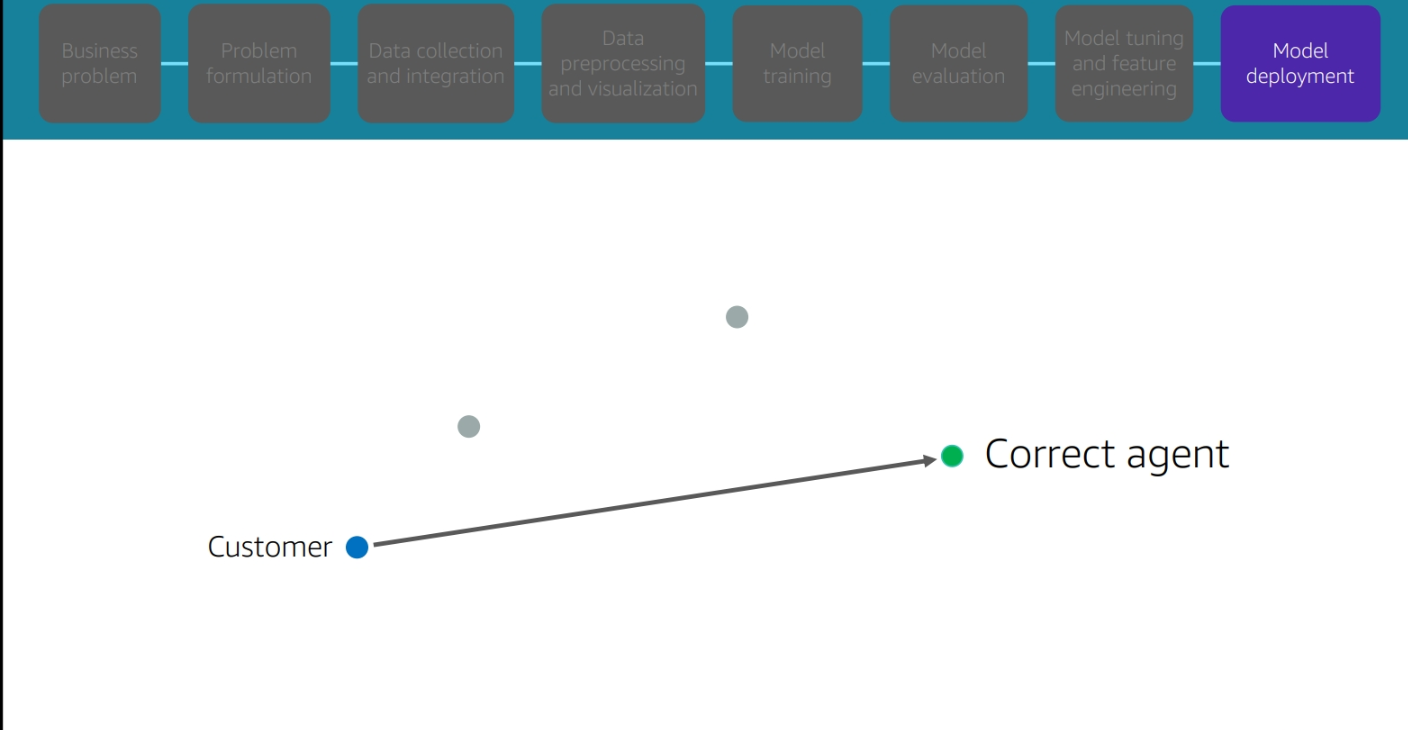
Model deployment
Module 2: AWS SageMaker
Amazon SageMaker is a fully-managed service used to build, train and deploy ML models at any scale. You can use part or all of Amazon SageMaker features.
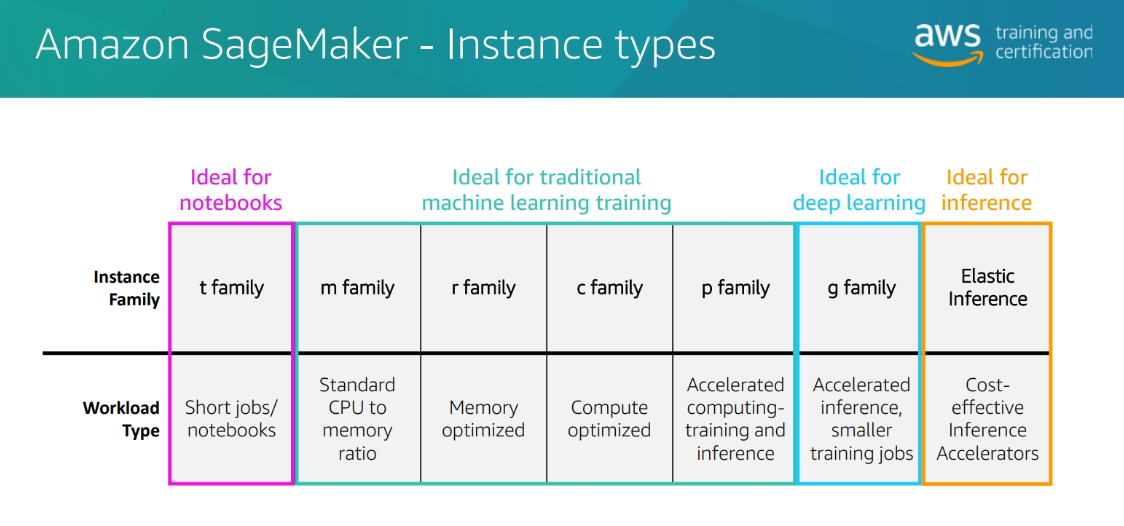
Instances Types
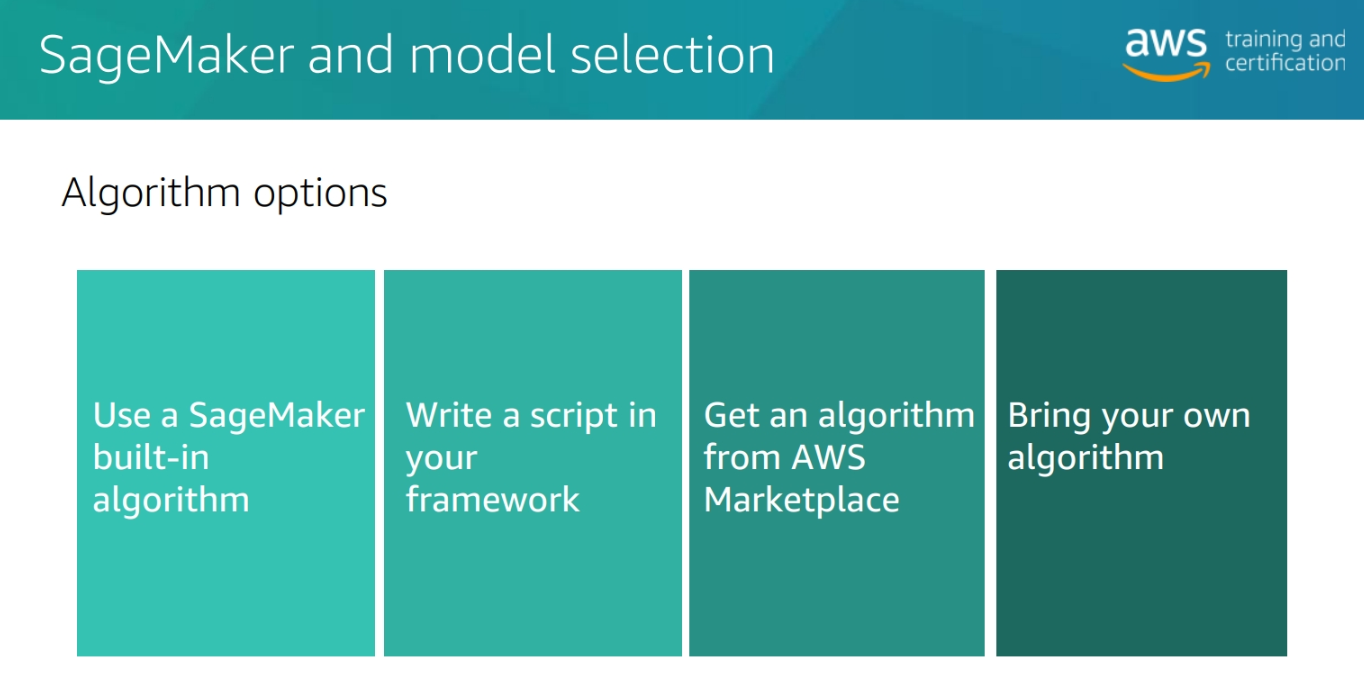
Algorithm options
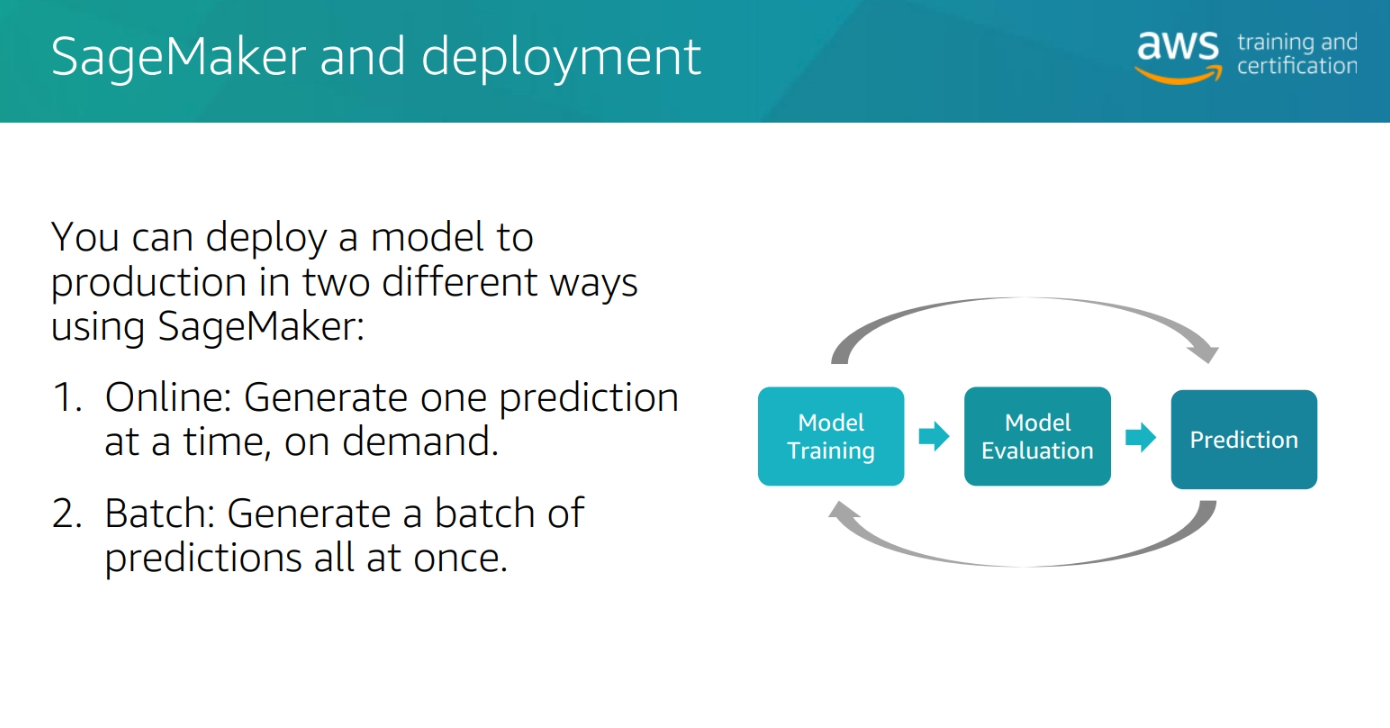
SageMaker Deploytme
Module 3 : Problem Formulation
Problem Formulation
Define Success
-
Model Performance metrics:
- Example: The model should have an accuracy of 90% in predicting whether a customer will buy a Kindle
- Accuracy
- Precision
- Recall
- F1 score
- AUC
- Example: The model should have an accuracy of 90% in predicting whether a customer will buy a Kindle
-
Business Metrics:
- Example: The model should increase the number of Kindles sold by 10%
- Revenue
- Customer satisfaction
- Customer retention
- Customer acquisition
- Example: The model should increase the number of Kindles sold by 10%
Module 4: Data Preoprocessing
Python libraries for data preprocessing
- Pandas: Data manipulation and analysis which provides data structures and functions to manipulate numerical tables and time series data.
import pandas as pd
- Numpy: A library for the Python programming language, adding support for large, multi-dimensional arrays and matrices, along with a large collection of high-level mathematical functions to operate on these arrays.
import numpy as np
- Matplotlib: A plotting library for the Python programming language and its numerical mathematics extension NumPy.
import matplotlib.pyplot as plt
- Seaborn: A Python data visualization library based on matplotlib. It provides a high-level interface for drawing attractive and informative statistical graphics.
import seaborn as sns
Statistics for data preprocessing
- Mean: The average of the numbers
- Median: The middle number
- Mode: The number that appears most often
- Standard Deviation: A measure of the amount of variation or dispersion of a set of values
- Variance: A measure of the amount of variation or dispersion of a set of values
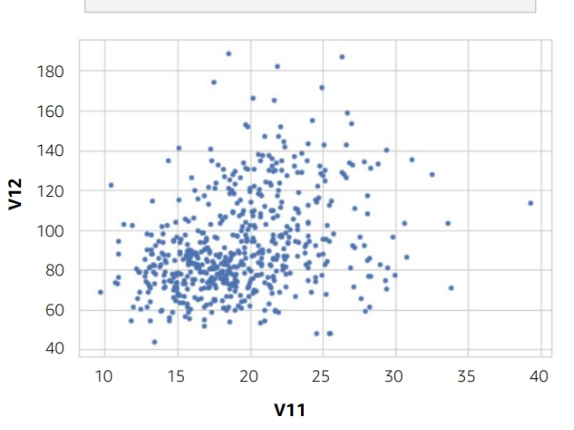
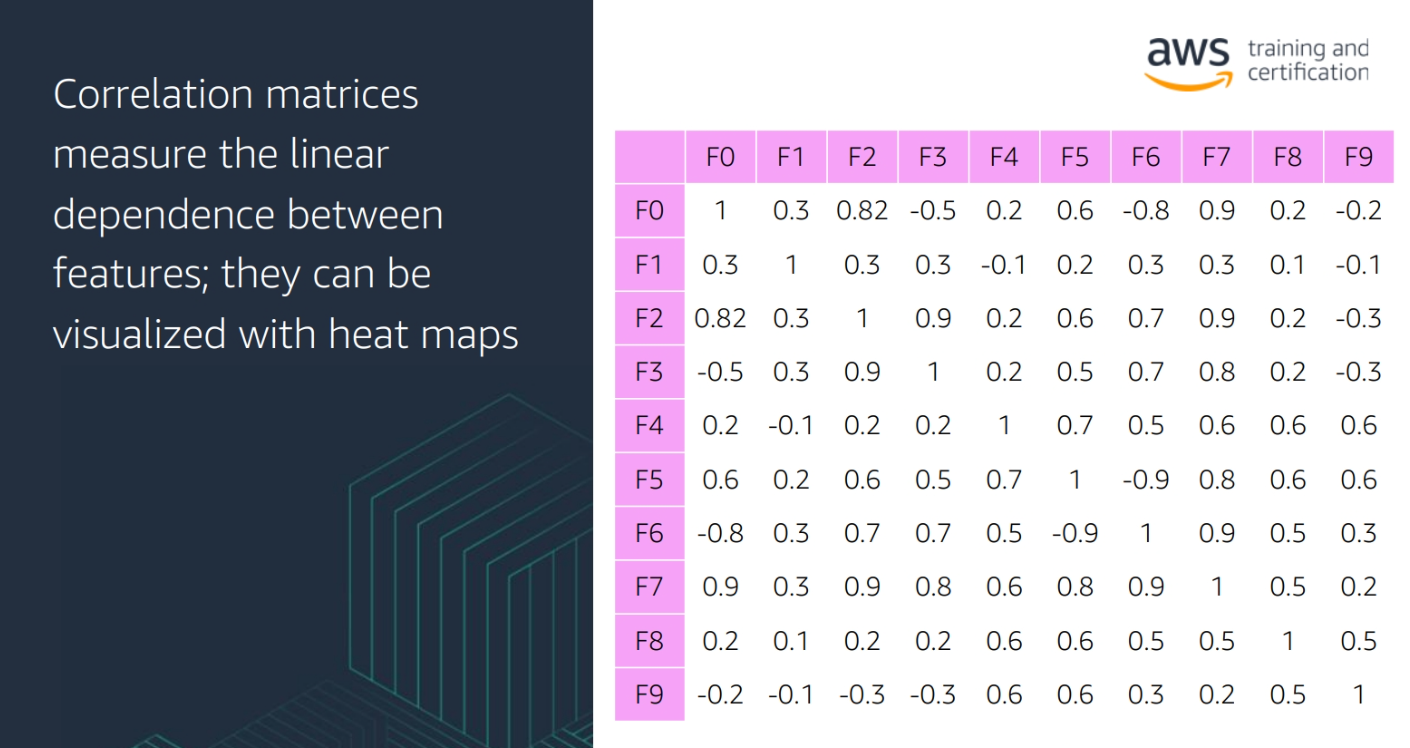
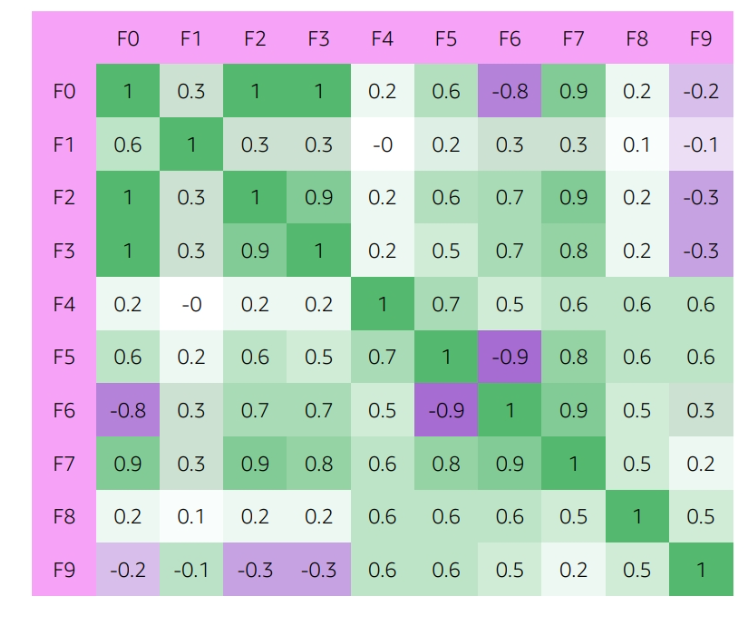
- Correlation: A measure of the strength and direction of the relationship between two variables
- Covariance: A measure of the relationship between two random variables
Dealing with outliers
-
Outliers: An observation that lies an abnormal distance from other values in a random sample from a population
-
Aritificial Outliers: Outliers that are created by errors in data collection or entry
-
Natural Outliers: Outliers that are part of the population
- ** Tranformation**: Logarithmic, square root, cube root, reciprocal, square, cube, exponential, and power transformations
- ** impute a value**: Replace the outlier with a value that is within the range of the data
-
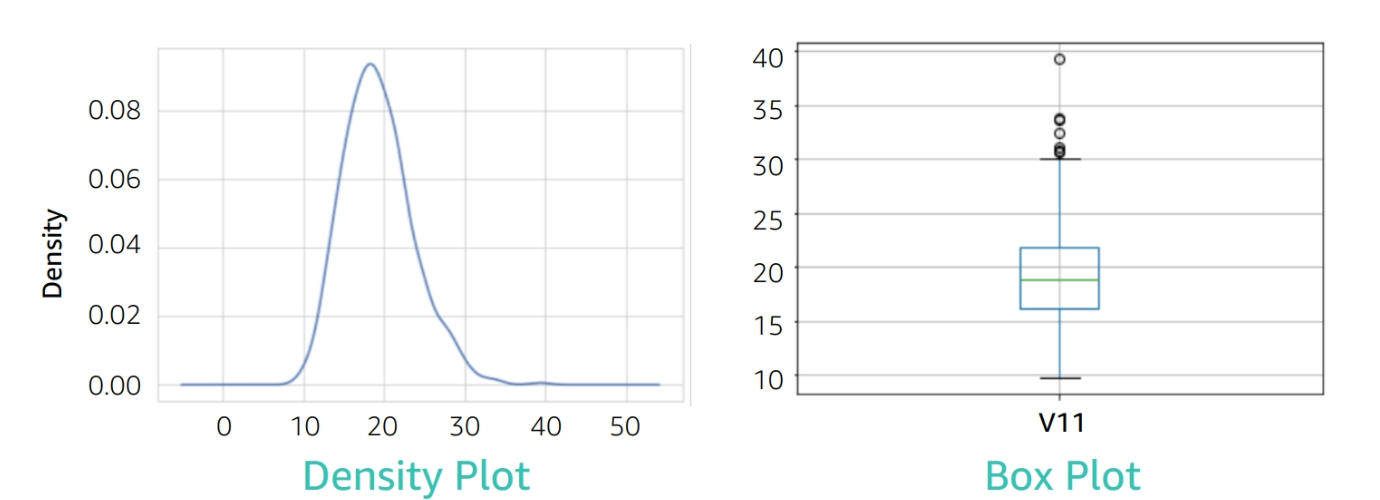
Methods to detect outliers:
- Boxplot
- Z-score
- IQR score
- Scatter plot
- Histogram
- DBSCAN
- Isolation Forest
- Local Outlier Factor
- Elliptic Envelope
- One-Class SVM
Module 5: Model Training
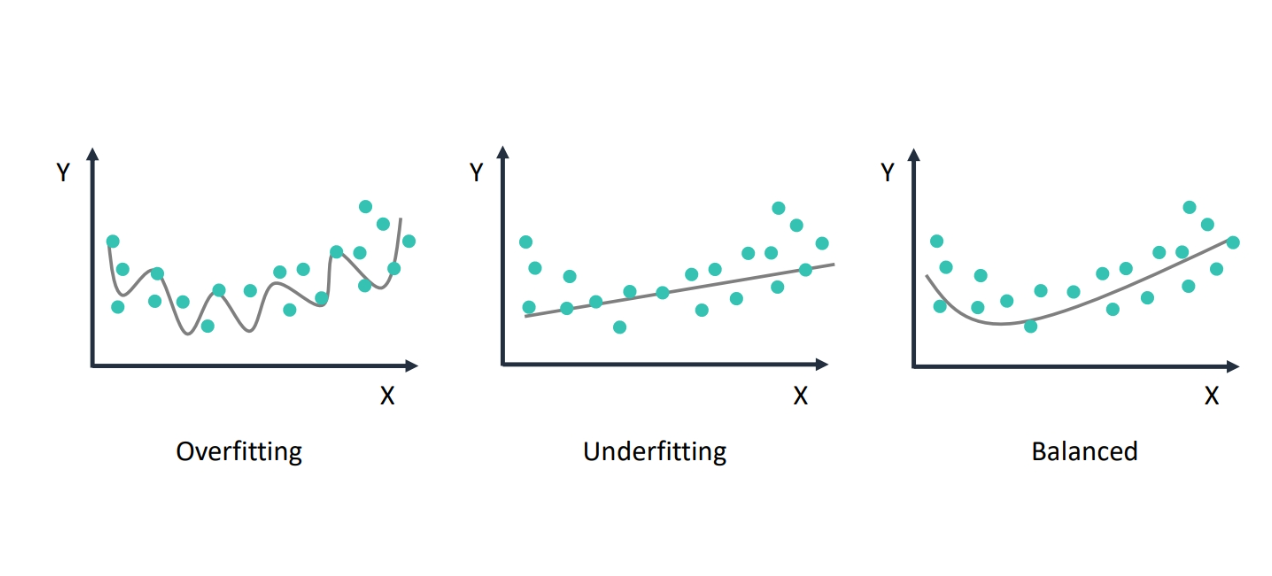
Overfitting and Underfitting and Balanced
-
Overfitting: The model is too complex and learns the training data too well
-
Underfitting: The model is too simple and does not learn the training data well
-
Balanced: The model learns the training data well and generalizes to new data
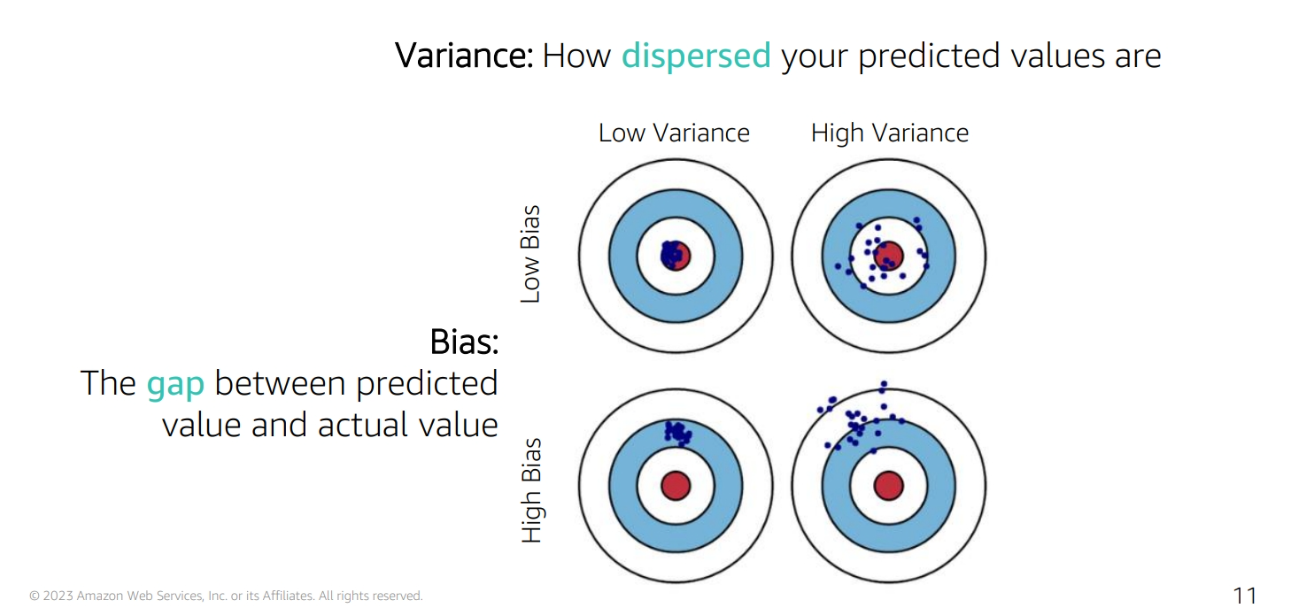
Bias and Variance
-
Bias: The error introduced by approximating a real-world problem, which may be extremely complicated, by a much simpler model
-
Variance: The error introduced by attempting to approximate a real-world problem by a much simpler model
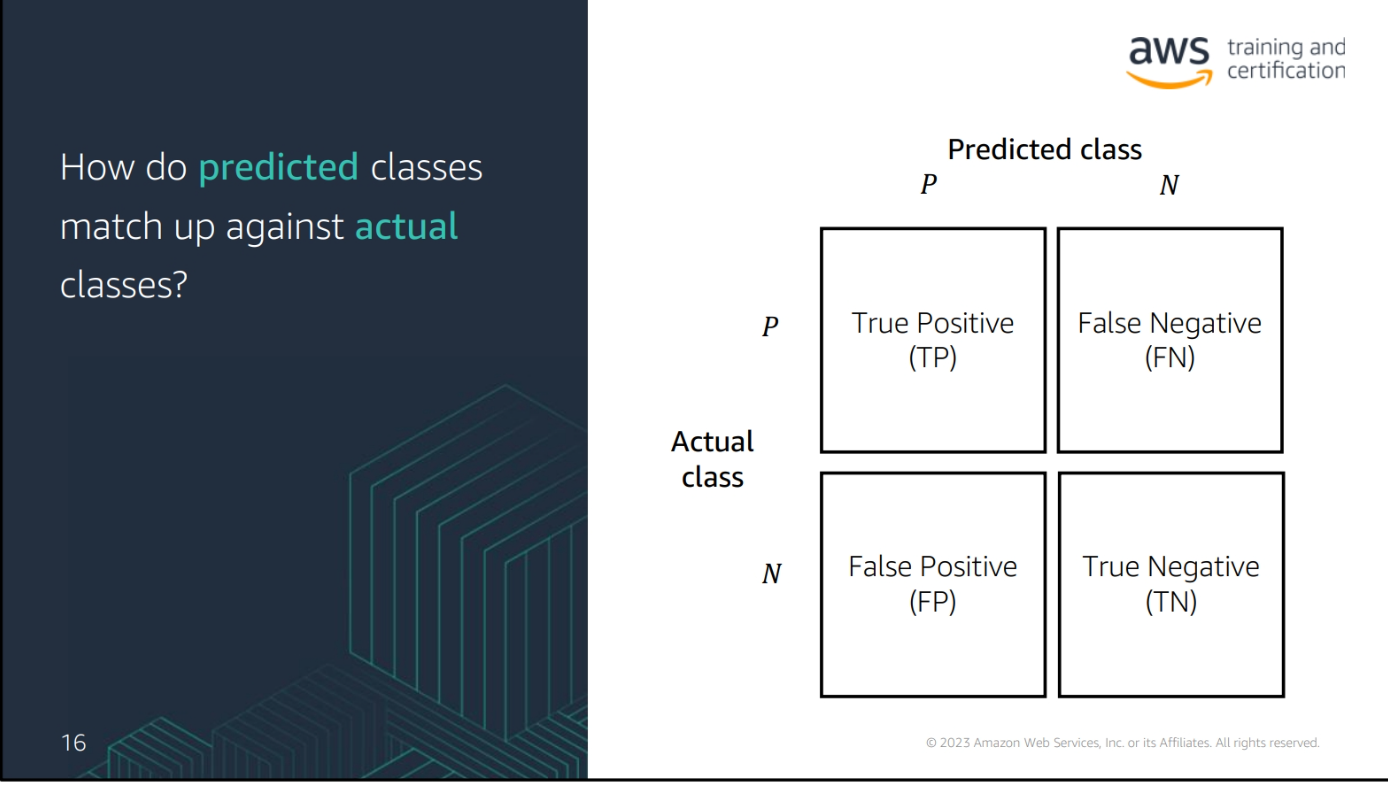
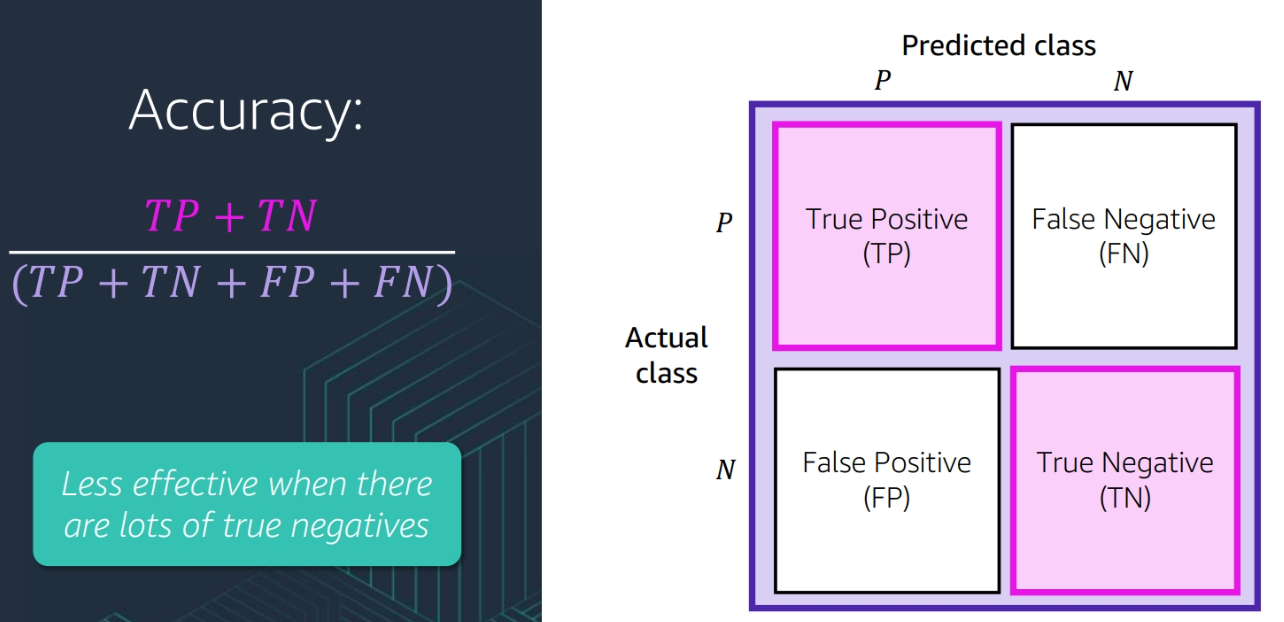
Confusion Matrix
-
True Positive (TP): The number of positive cases that were correctly predicted
-
True Negative (TN): The number of negative cases that were correctly predicted
-
False Positive (FP): The number of negative cases that were incorrectly predicted as positive
-
False Negative (FN): The number of positive cases that were incorrectly predicted as negative
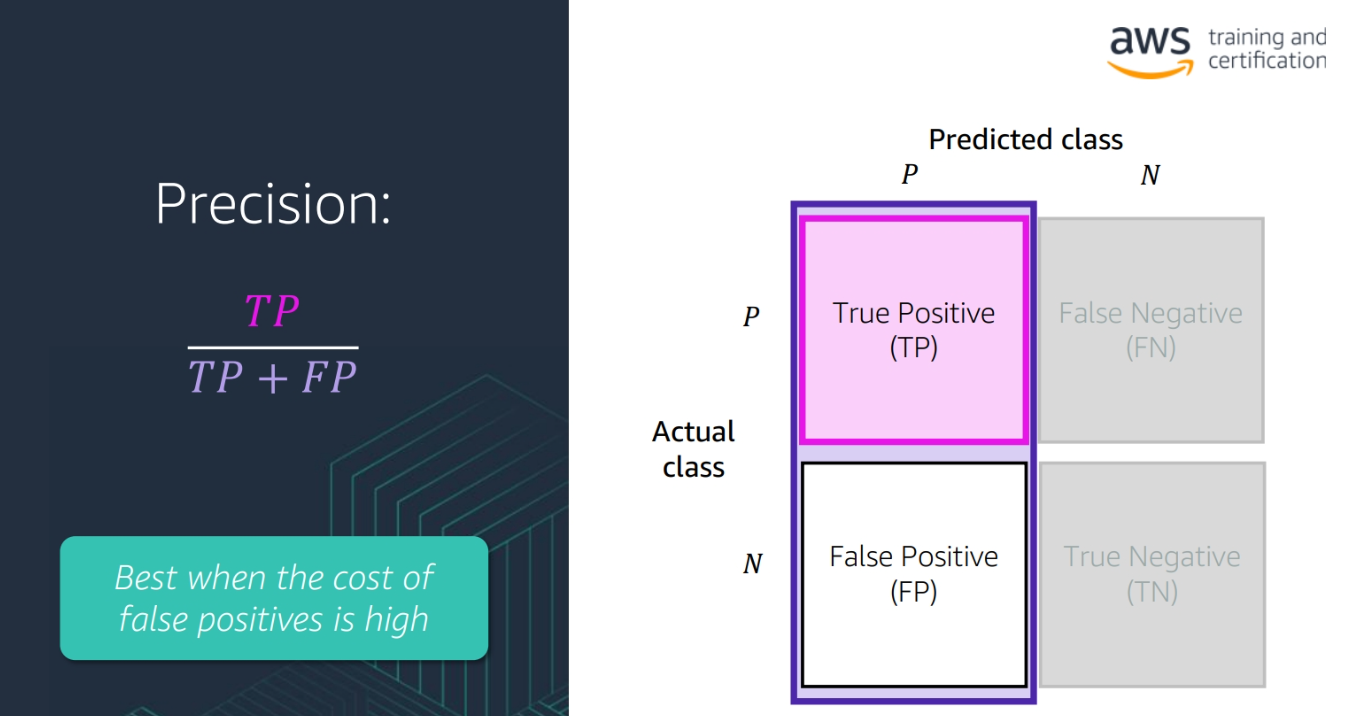
Precision, Recall, F1 Score, and AUC
- Precision: The number of true positive cases divided by the number of true positive and false positive cases
(TP / (TP + FP))
- Accuracy: The number of true positive and true negative cases divided by the total number of cases
(TP + TN) / (TP + TN + FP + FN)
-
Recall: The number of true positive cases divided by the number of true positive and false negative cases
(TP / (TP + FN))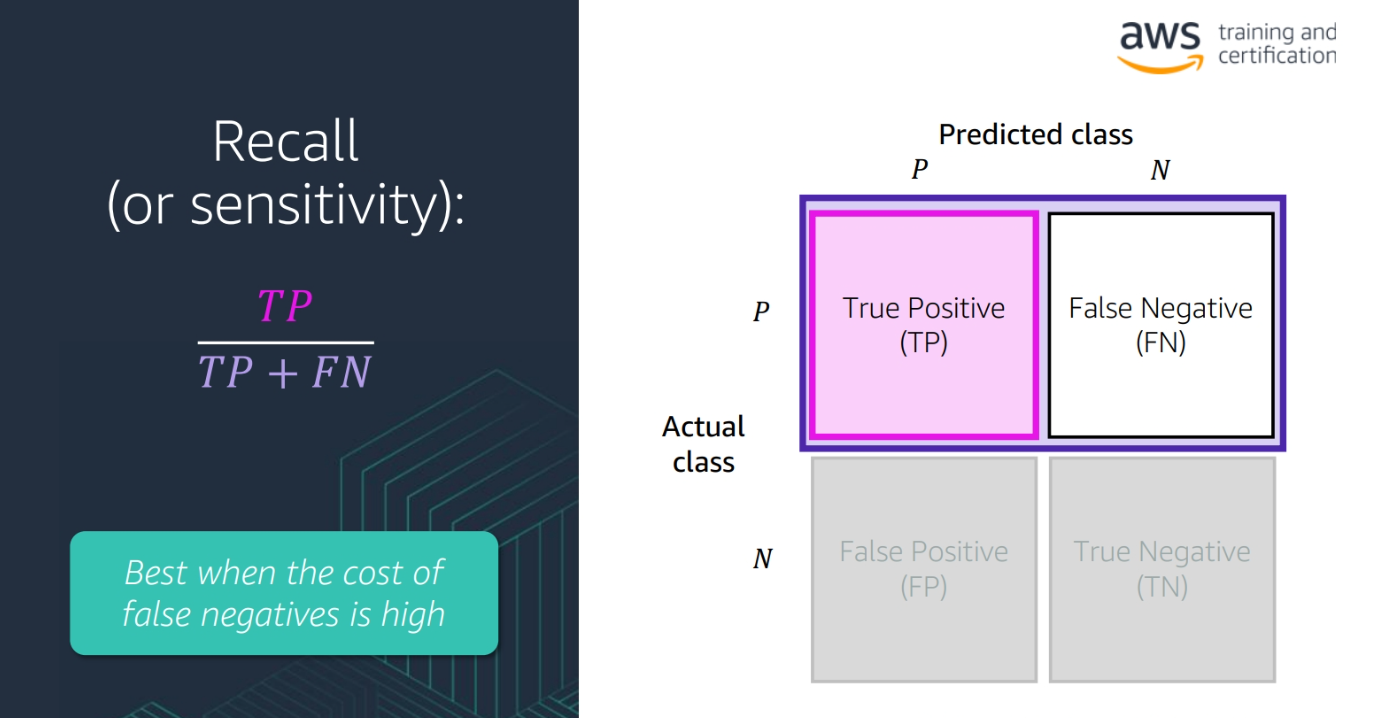
-
F1 Score: The harmonic mean of precision and recall
2 * (precision * recall) / (precision + recall) -
AUC: The area under the receiver operating characteristic curve, which is a plot of the true positive rate against the false positive rate
-
ROC Curve: A plot of the true positive rate against the false positive rate
-
AUC-ROC curve is a performance measurement for classification problem at various threshold settings. ROC is a probability curve and AUC represents degree or measure of separability. It tells how much model is capable of distinguishing between classes. Higher the AUC, better the model is at predicting 0s as 0s and 1s as 1s. By analogy, the Higher the AUC, the better the model is at distinguishing between patients with disease and no disease.
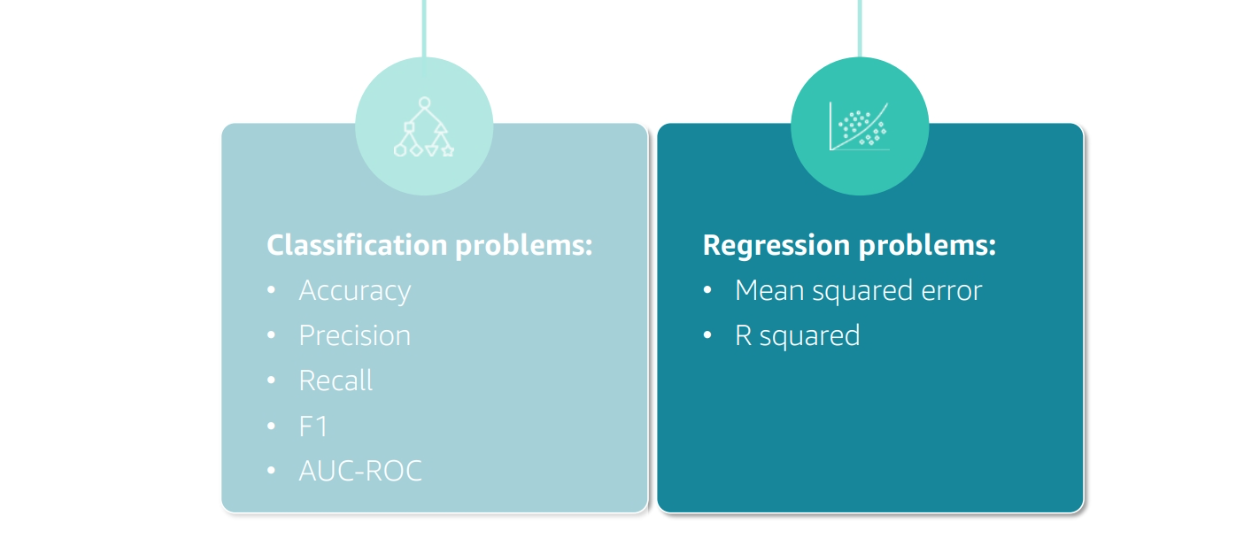
Types of Problems Score
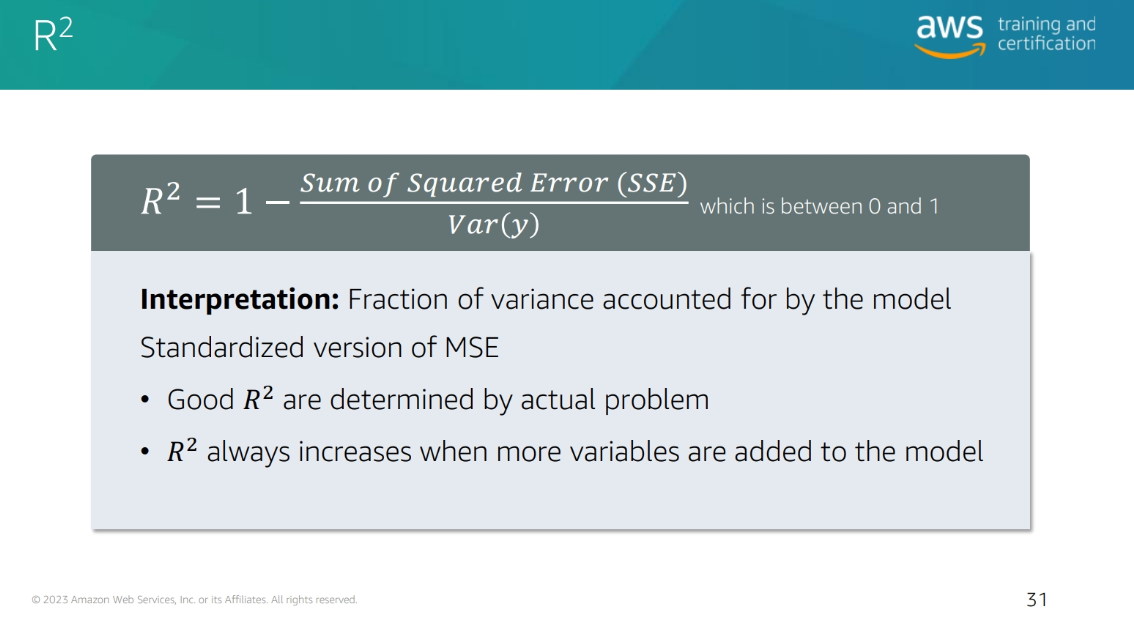
R2
Module 7: Model Tuning and Feature Engineering
Feature Engineering components
-
Feature Selection: Selecting the most important features
-
Feature Extraction: Extracting new features from existing features
-
Feature Transformation: Transforming features to improve model performance
-
Feature Scaling: Scaling features to improve model performance
Techniques
Why we choose feature engineering
-
Improve model performance: Feature engineering can improve the performance of a model
-
Reduce overfitting: Feature engineering can reduce overfitting by removing irrelevant features
-
Reduce underfitting: Feature engineering can reduce underfitting by adding relevant features
-
Improve interpretability: Feature engineering can improve the interpretability of a model by creating features that are easier to understand
Why change numerical to small number
-
Reduce computational cost: Smaller numbers require less memory and less computation
-
** Make the model more aware of the scale of the data**: The model will be more aware of the scale of the data and will be able to learn more effectively
Note : so the model think that the small number is more important than the large number
why change numerical to categorical
- make more sense to the model example: Age: 0-18, 19-30, 31-50, 51-70, 71-100 This will make more sense to the model than the original numerical data
Scaling transformation techniques
- Min-Max Scaling: Scales the data to a fixed range, usually 0 to 1
- Standardization: Scales the data to have a mean of 0 and a standard deviation of 1
- Max Abs Scaling: Scales the data to a fixed range, usually -1 to 1 or 0 to 1
- Normalization: Scales the data to have a magnitude of 1
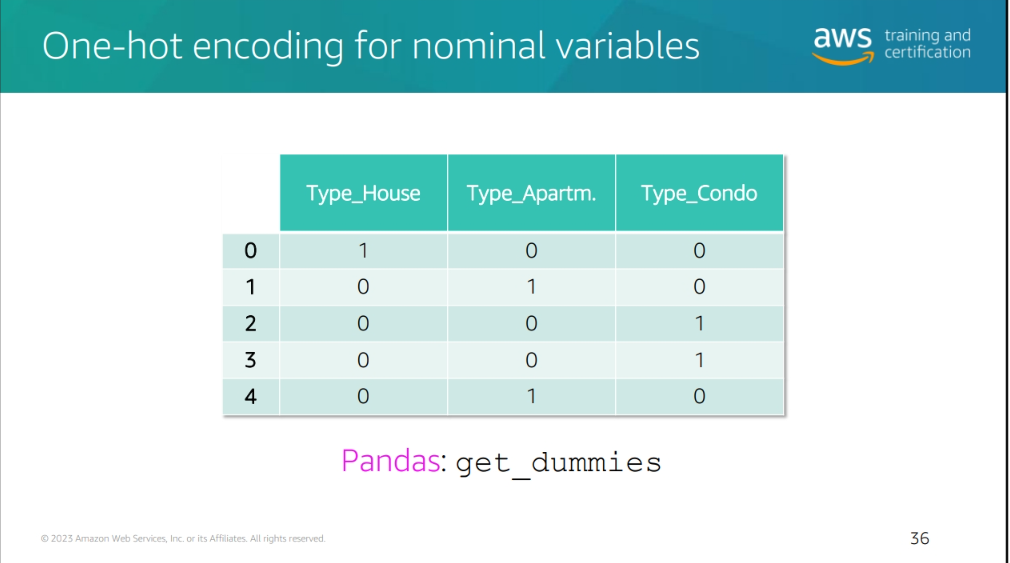
one hot encoding
- One-Hot Encoding: A method of converting categorical data into a format that can be provided to ML algorithms to do a better job in prediction. It is a process of converting categorical data into a binary matrix format.
sometimes it's not efficient to do this so you could try
- **Group By somthing Similar
Hyperparameter Tuning
- Hyperparameters: Parameters that are set before the model is
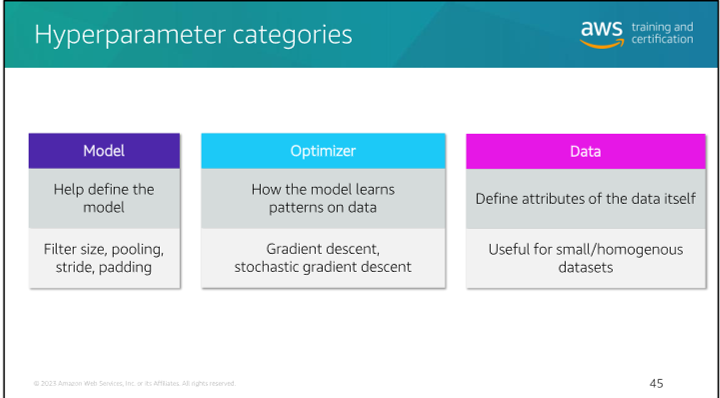
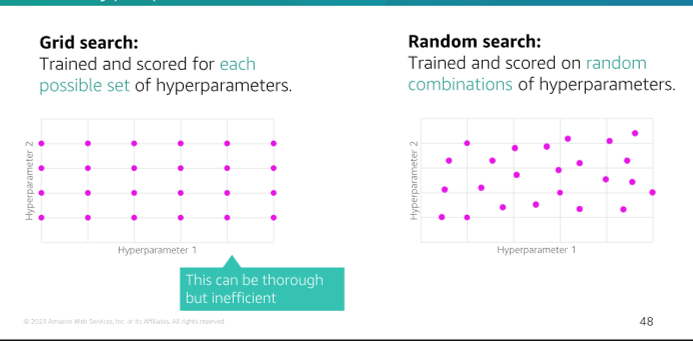
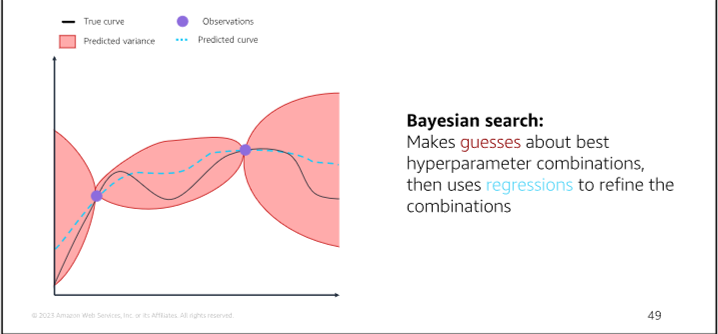
Hyperparameter Tuning seearch methods
-
Grid Search: A method of hyperparameter tuning that searches through a specified subset of hyperparameters
-
Random Search: A method of hyperparameter tuning that searches through a random subset of hyperparameters
-
Bayesian Optimization: A method of hyperparameter tuning that uses a probabilistic model to search through a subset of hyperparameters
Model 8 Model Deployment
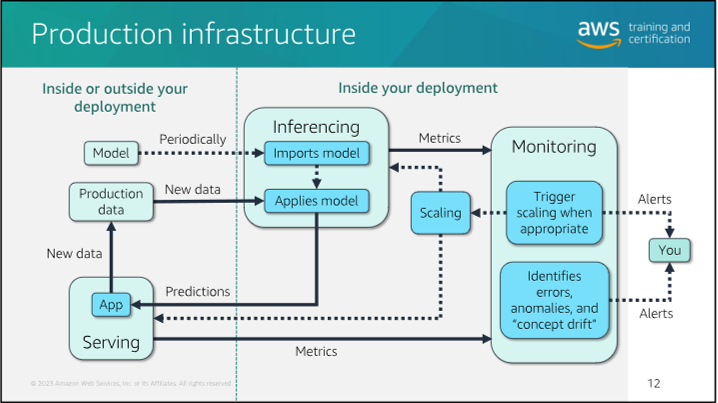
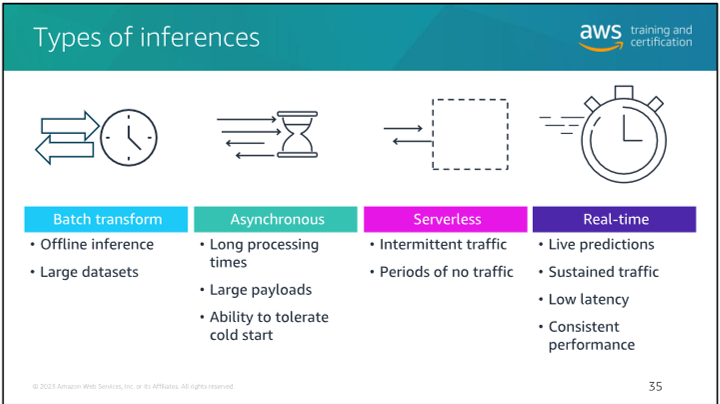
Types of inferences
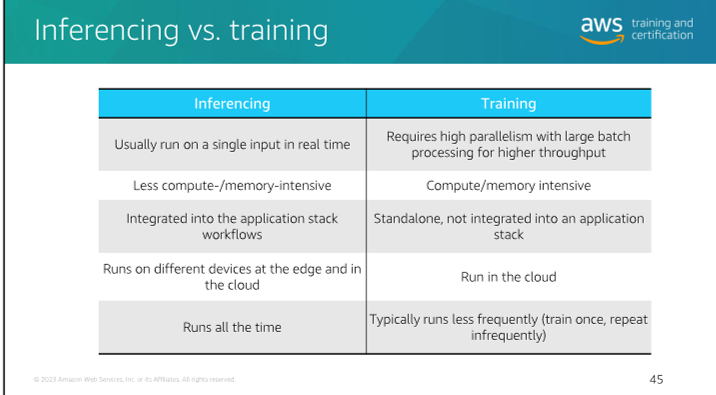
Inferecing vs. Training
-
Blue-Green Deployment and Canary Deployment:
- Blue-Green Deployment:
- What is it? Blue-green deployment is a release management strategy used in software deployment. It involves maintaining two identical production environments: one called "Blue" (the active environment) and the other "Green" (the inactive environment).
- How does it work?
- Preparation: Set up a staging environment (Green) that mirrors the production environment (Blue).
- Deployment: Deploy the new version of your application to the inactive environment (Green).
- Testing: Thoroughly test the new version in the inactive environment to ensure stability.
- Switch: Once confident, switch users to the Green environment, making it the new active production environment.
- Goal: Minimize downtime and reduce risk during software updates.
- Canary Deployment:
- What is it? Canary deployment gradually rolls out new software versions to a controlled subset of users before deploying to everyone.
- How does it work?
- Incremental Rollout: Deploy the new version to a percentage of users (the "canaries").
- Monitoring: Monitor canaries' feedback and performance.
- Iterate: Address any issues that arise. If successful, proceed with a full-scale release.
- Goal: Identify and fix issues early, minimizing widespread problems or outages.
- Blue-Green Deployment:
-
Amazon SageMaker:
- What is it? Amazon SageMaker is a fully managed machine learning (ML) service provided by AWS.
- Features:
- Build, Train, and Deploy: Data scientists and developers can build, train, and deploy ML models in a production-ready hosted environment.
- UI Experience: SageMaker provides a user-friendly interface for ML workflows across multiple integrated development environments (IDEs).
- Managed ML Algorithms: Efficiently run ML algorithms against large data in a distributed environment.
- Flexible Training Options: Supports custom algorithms and frameworks.
- Secure and Scalable Deployment: Easily deploy models from the SageMaker console.
- Use Cases: SageMaker is ideal for various ML tasks, including image classification, natural language processing, and time series forecasting.
- Point Clouds and SageMaker:
- Amazon SageMaker Ground Truth simplifies labeling objects in 3D point clouds for ML training datasets.
- It supports sensor fusion of camera and LiDAR data, making it useful for applications like autonomous vehicles.