Exploratory Data Analysis
Exploratory Data Analysis
Python
Pandas
Pandas is a fast, powerful, flexible and easy to use open source data analysis and data manipulation library built on top of the Python programming language.
-
Data Frame: A two-dimensional data structure, i.e., data is aligned in a tabular fashion in rows and columns.
-
Series: A one-dimensional labeled array capable of holding data of any type (integer, string, float, python objects, etc.). The axis labels are collectively called index.
-
Panel: A three-dimensional data structure, i.e., data is aligned in a tabular fashion in rows, columns and panels.
Matplotlib
Matplotlib is a comprehensive library for creating static, animated, and interactive visualizations in Python.
-
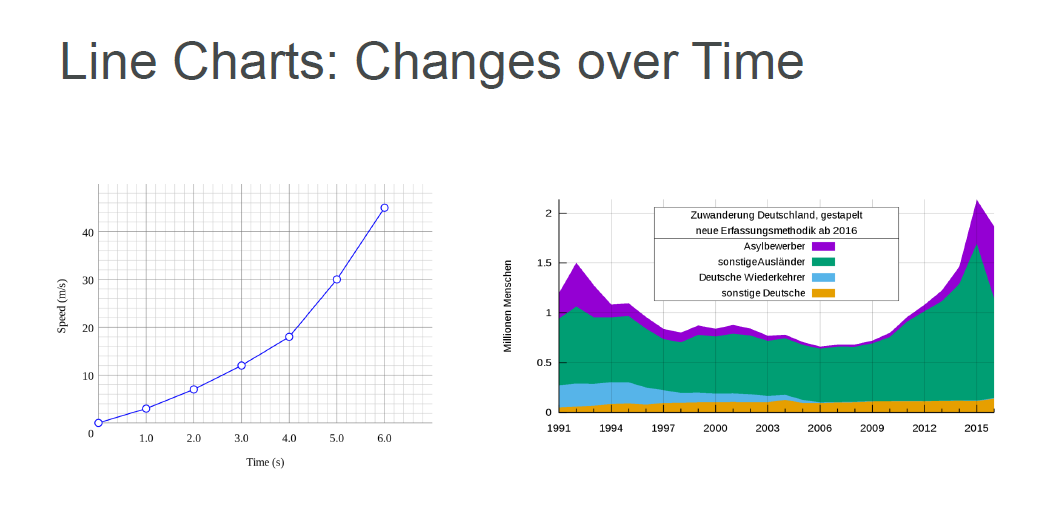
Line Plot: A line plot is a graph that shows frequency of data along a number line.
-
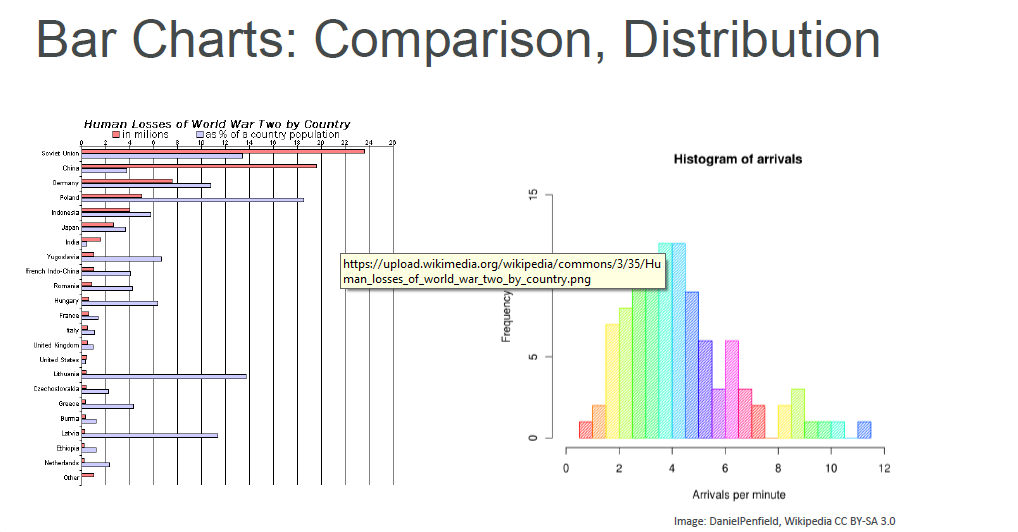
Bar Plot: A bar plot is a graph that represents the category of data with rectangular bars.
-
Histogram: A histogram is a graph showing frequency distributions.
-
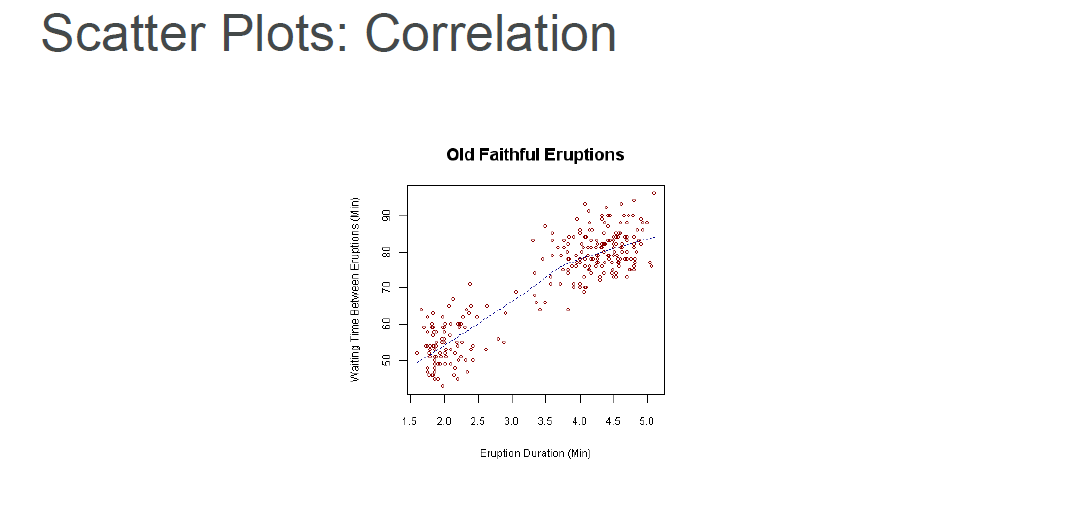
Scatter Plot: A scatter plot is a graph that shows the relationship between two sets of data.
-
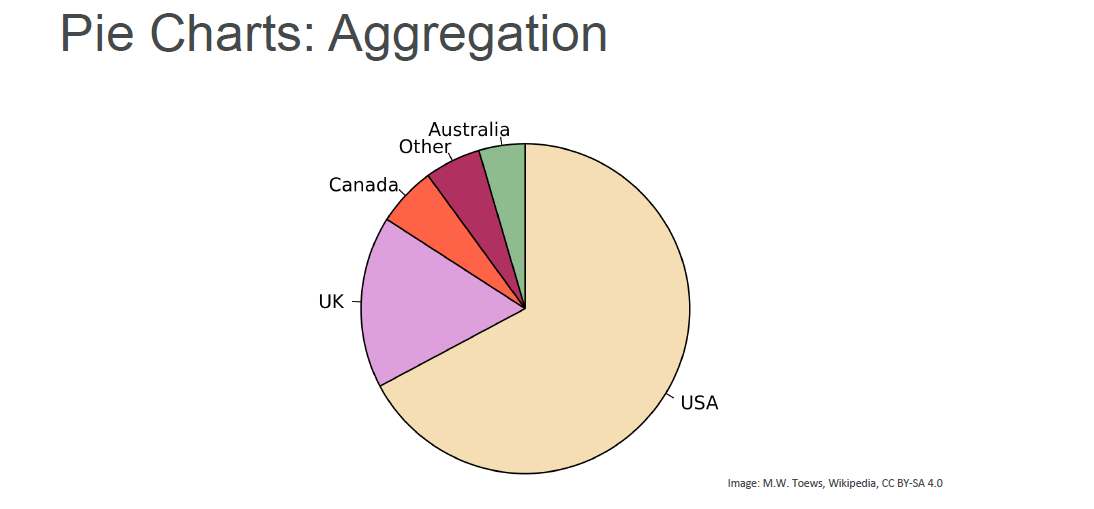
Pie Chart: A pie chart is a circular statistical graphic, which is divided into slices to illustrate numerical proportion.
-
Box Plot: A box plot is a graph that gives you a good indication of how the values in the data are spread out.
-
Violin Plot: A violin plot is a method of plotting numeric data and can be considered a combination of the box plot with a kernel density plot.
-
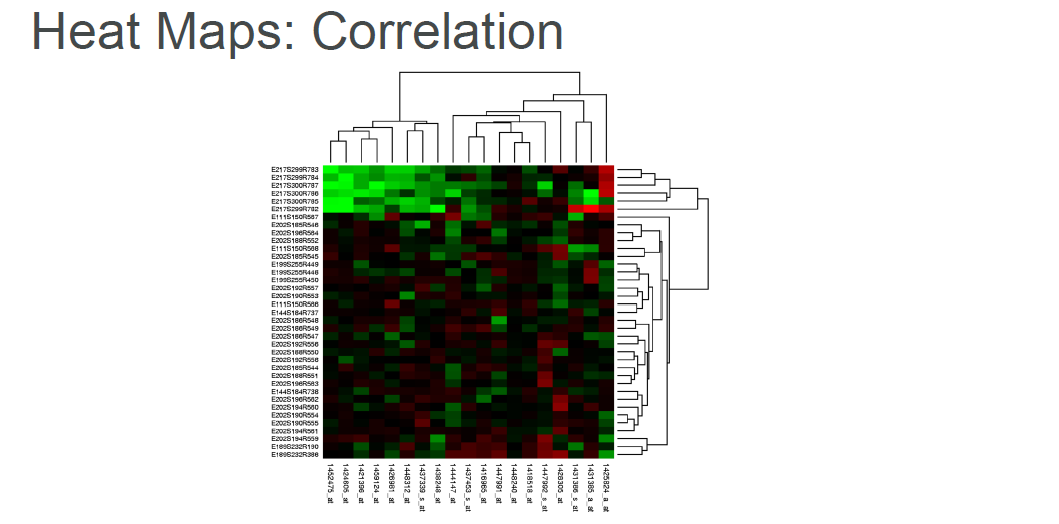
Heat Map: A heat map is a graphical representation of data where the individual values contained in a matrix are represented as colors.
-
3D Plot: A 3D plot is a graph that shows the relationship between three sets of data.
-
Contour Plot: A contour plot is a graphical technique for representing a 3-dimensional surface by plotting constant z slices, called contours, on a 2-dimensional format.
-
Quiver Plot: A quiver plot is a type of 2D plot that shows vector lines as arrows.
-
Stream Plot: A stream plot is a type of 2D plot that shows vector field.
-
Polygon Plot: A polygon plot is a type of 2D plot that shows a filled polygon.
-
Image Plot: An image plot is a type of 2D plot that shows an image.
-
Polar Plot: A polar plot is a type of 2D plot that shows data in polar coordinates.
-
3D Surface Plot: A 3D surface plot is a type of 3D plot that shows a surface.
Major Types of Data
Numerical
- Discrete: Discrete data can only take particular values. There may potentially be an infinite number of those values, but each is distinct and there's no grey area in between.
- Continuous: Continuous data can take any value within a given range.
Categorical
-
Quantitative: Quantitative data is data expressing a certain quantity, amount or range. Usually, there are measurement units associated with the data.
-
Nominal: Nominal data is a group of non-parametric variables, that is, variables that do not follow a regular distribution.
Time Series
-
Cross-Sectional: Cross-sectional data is data collected by observing many subjects (such as individuals, firms, countries, or regions) at the same point of time, or without regard to differences in time.
-
Time Series: Time series data is a sequence of data points in chronological order, such as daily closing stock prices or monthly temperatures.
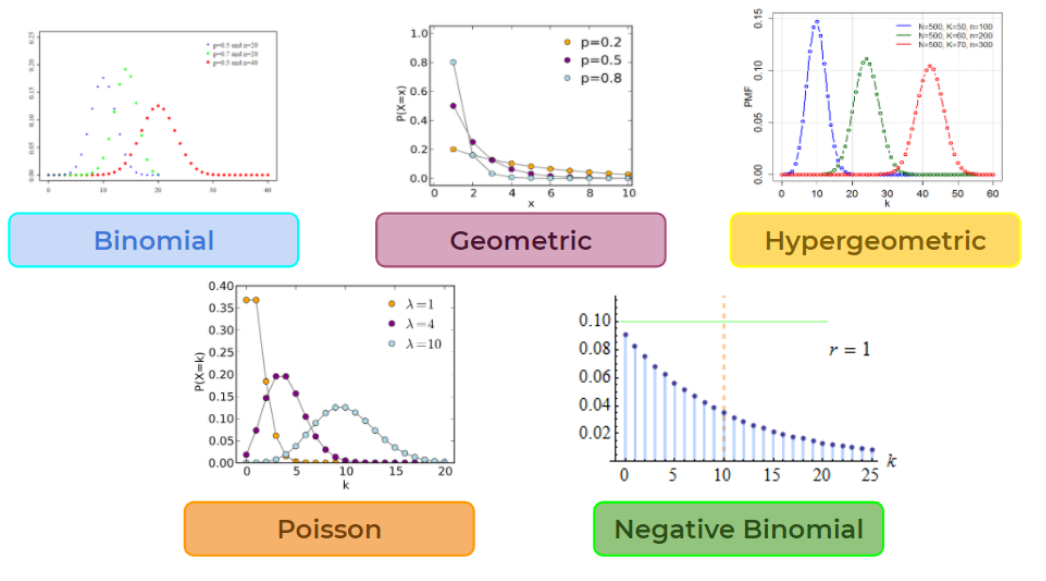
Type of data distribution
Amazon Athena
Amazon Athena is an interactive query service that makes it easy to analyze data in Amazon S3 using standard SQL. Athena is serverless, so there is no infrastructure to manage, and you pay only for the queries that you run.
Amazon QuickSight
Amazon QuickSight is a fast, cloud-powered business intelligence service that makes it easy to deliver insights to everyone in your organization. As a fully managed service, QuickSight lets you easily create and publish interactive dashboards that include ML Insights.
For more Details visit
Architecting-on-AWSArchitecting-on-AWSDay 1: AWS Security and Identity Management Create Role Trust Policy: The trust policy defines who or what can assume the role. It outlines the entities that are allowed to take on the permissions associated with the role. This can include AWS services, users, accounts, or even external identities Permissions Policy: The permissions policy specifies what actions and resources the role is allowed to access or manipulate. It defines the boundaries of the role's capabilities within AWS. Permissi
Data LakesData LakesData Lake Introduction to data lakes Why Data Lakes? 1. Are a great way to store and analyze large volumes of data at a low cost. 1. Exponential growth of data. 1. unstructured data. - Text - Images - Videos - Audio 1. Need analytics faster - Days - Hours - Real time Benefits of Data Lakes Data warehouse vs Data Lake Data Lake Analytics Functionality vs Aws This Course will cover AWS Glue AWS Glue is a fully managed extract, transform, and load (ETL) ser
SPICE
SPICE (Super-fast, Parallel, In-memory Calculation Engine) is a general purpose, distributed, shared-nothing, parallel processing framework for in-memory analytics. SPICE is designed to be a highly available, fault-tolerant, and self-healing system that provides high throughput and low latency for data processing and analytics.
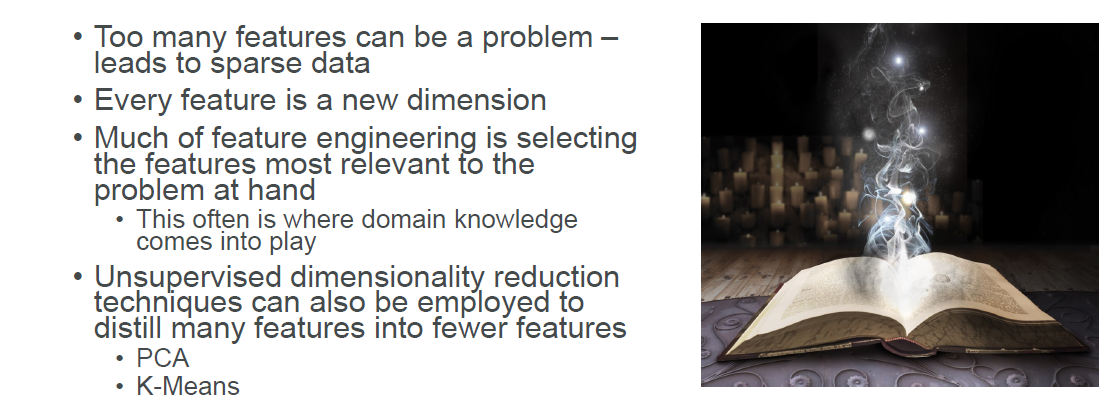
The Curse of Dimensionality
Imputing Missing Data : Mean, Median, Mode Replacement
Replacing missing data with the mean, median, or mode is a common method for handling missing data. This method is also known as univariate imputation. Univariate imputation is the process of replacing missing data with a statistical estimate of the missing value.
Imputing Missing Data : Random Sample Imputation
Random sample imputation is a technique where we take random observations from the dataset and we use this observation to replace the NaN values. It consists of taking random observation from the dataset and we use this observation to replace the NaN values.
Imputing Missing Data : Capturing NaN values with a new feature
This technique involves replacing the NaN values with a new feature which captures the NaN values. It is a good method when the data is not missing at random.
Imputing Missing Data : Machine Learning Algorithm
This technique involves replacing the NaN values with a new feature which captures the NaN values. It is a good method when the data is not missing at random.
KNN: Find K “nearest” (most similar) rows and average their values Assumes numerical data, not categorical There are ways to handle categorical data (Hamming distance), but categorical data is probably better served by…
Deep Learning Build a machine learning model to impute data for your machine learning model! Works well for categorical data. Really well. But it’s complicated.
Regression Find linear or non-linear relationships between the missing feature and other features Most advanced technique: MICE (Multiple Imputation by Chained Equations)
unbalanced data
Unbalanced data typically refers to a problem with classification problems where the classes are not represented equally.
Random Under-Sampling: Randomly remove samples from the majority class.
Random Over-Sampling: Randomly duplicate samples from the minority class.
SMOTE (Synthetic Minority Over-sampling Technique): Generate synthetic samples from the minority class.
Cluster-Based Over Sampling: Generate synthetic samples by generating clusters of the minority class.
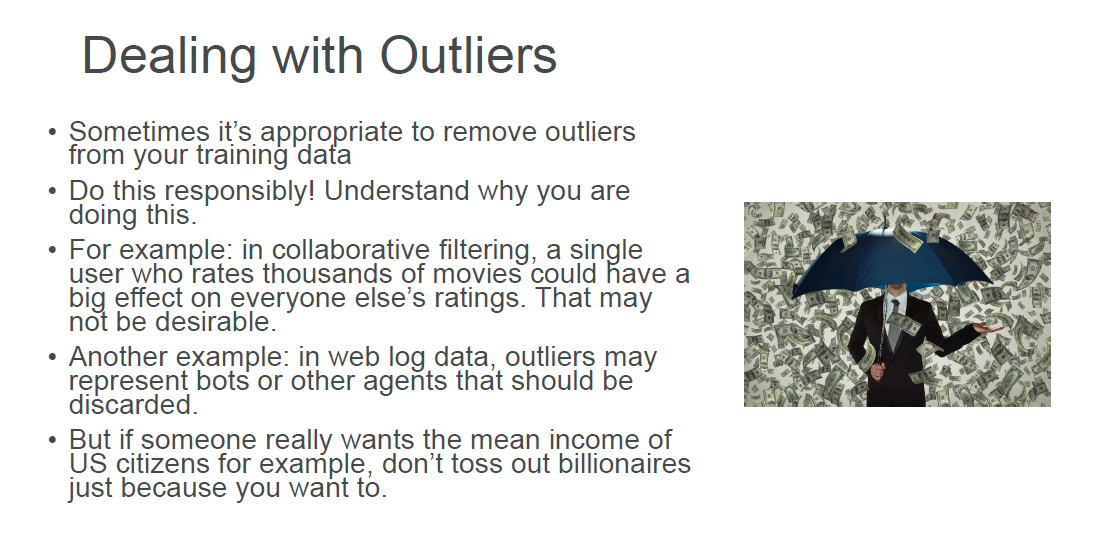
Handling outliers
Removing outliers: Remove the outliers from the dataset.
SageMaker Ground Truth
Machine Learning Pipeline on AWSMachine Learning Pipeline on AWSMachine Learning Pipeline on AWS Course Objectives - Select and justify the appropriate ML approach to a problem - Build ,train ,evaluate and deploy and fine-tune and ML model - Apply the steps of the Ml pipeline to solve the problem - Describe Best practices for training and deploying ML models pipeline in AWS - Identify the steps to apply the ML to business problems Course Outline Module 1: Introduction to Machine Learning and Ml Pipeline Data + Algorithm + Time = Model Inferenc
Next Steps
https://rxhl.notion.site/AWS-Machine-Learning-Specialty-4c51dfb5ae1e476284e215305b7a5d5b